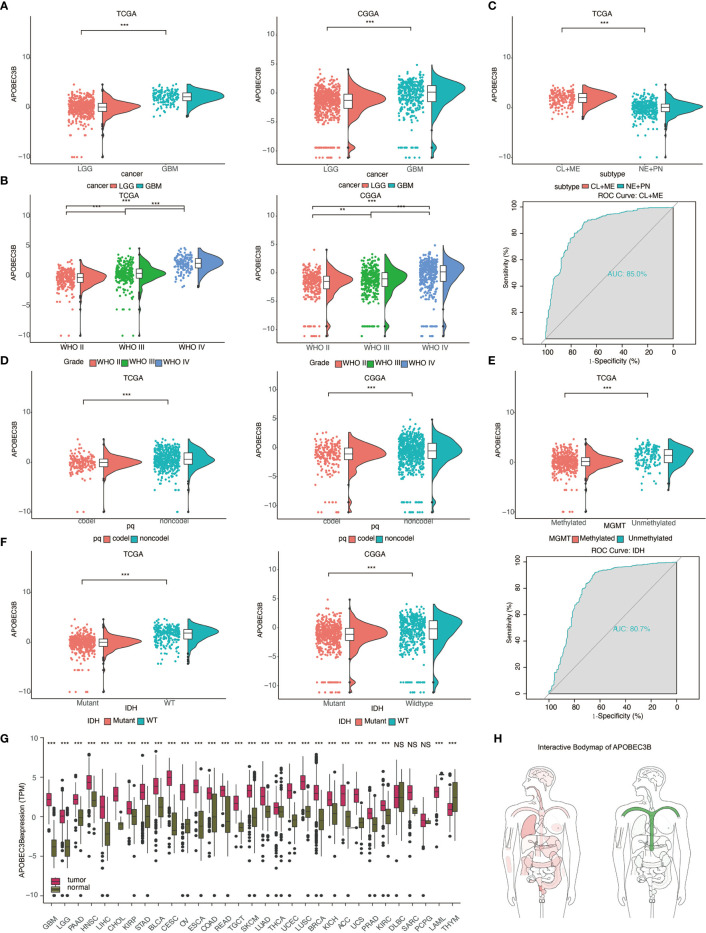
Figure 1.
The expression level of APOBEC3B is increased in aggressive glioma and other cancers. Analysis of APOBEC3B mRNA levels in (A) LGG and GBM (B) WHO grade II–IV gliomas (D) 1p19q codeletion and non-codeletion from TCGA and CGGA datasets. (C) APOBEC3B expression in distinct subclasses(upper), ROC curve indicating sensitivity and specificity of APOBEC3B expression as a discriminative biomarker for CL+ME subtypes and GBM (lower). (E) APOBEC3B expression in MGMT methylated and unmethylated. (F) Analysis of APOBEC3B level in IDH mutant and wildtype from TCGA and CGGA. ROC curve indicates the sensitivity and specificity of APOBEC3B expression as a diagnostic biomarker for discriminate IDH mutation from non-IDH mutation. (G) APOBEC3B mRNA expression levels in pan-cancer. (H) The median expression of tumor (red) and normal (green) samples in bodymap. NS, Not Statistically Significant; *P < 0.05; **P < 0.01; ***P < 0.001; ****P < 0.0001.

