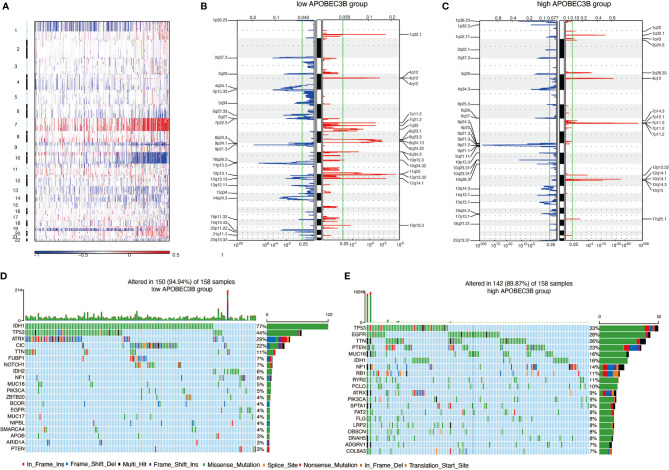
Figure 4.
APOBEC3B expression is related to genomic alterations in glioma. (A) Overall CNV profile according to high vs low APOBEC3B expression. Blue (deletion); Red (amplification). Frequency of specific changes based on (B) APOBEC3Blow and (C) APOBEC3Bhigh groups. The X-axis represents the frequency of chromosomal deletion (blue) or amplification (red). Spectrum of somatic mutations in gliomas from (D) APOBEC3Blow and (E) APOBEC3Bhigh groups.

