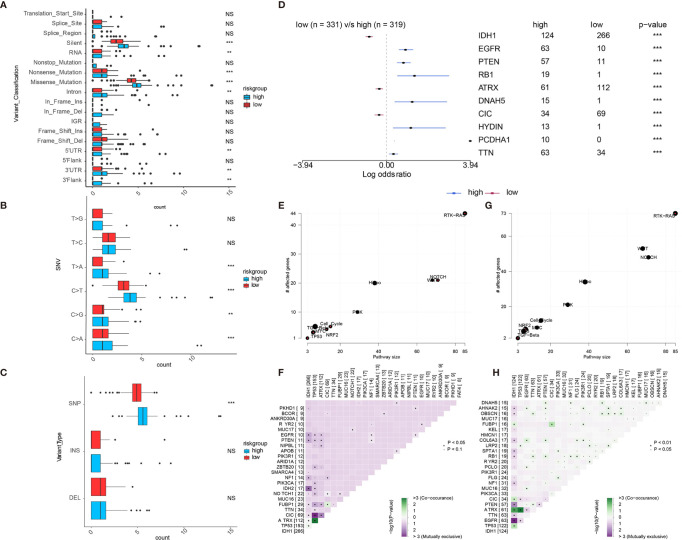
Figure 5.
Landscape of somatic mutation in APOBEC3Bhigh and APOBEC3Blow groups. (A–C) the comparisons of mutation frequencies of (A) every mutation type classified by effects, (B) SNVs, (C) INDEL and SNP. (D) Forest plot shows the top 10 most significantly differentially mutated genes between two groups. Common carcinogenic pathways in (E) APOBEC3Blow and (G) APOBEC3Nhigh group. The heatmap indicates the mutually exclusive mutations and co-occurring of the frequently mutated genes in (F) APOBEC3Blow and (H) APOBEC3Nhigh groups. NS, Not Statistically Significant; *P < 0.05; **P < 0.01; ***P < 0.001; ****P < 0.0001.

