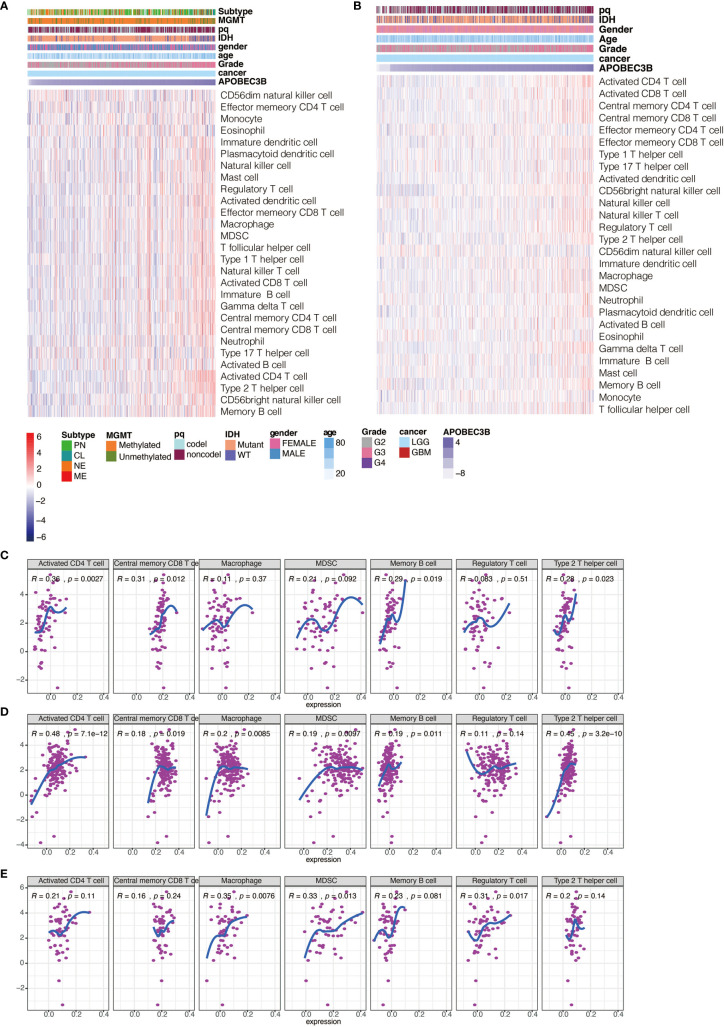
Figure 7.
Heatmaps illustrating the relationship between APOBEC3B and immune cell populations based on (A) TCGA and (B) CGGA in LGG patients. Correlation of APOBEC3B expression with immune infiltration cells including activated CD4+T cells, central memory CD8+T cells, macrophages, MDSC, memory B cell, regulatory T cells and Th2 cells in (C) KICH, (D) PAAD< (E) UCS.

