Figure 9.
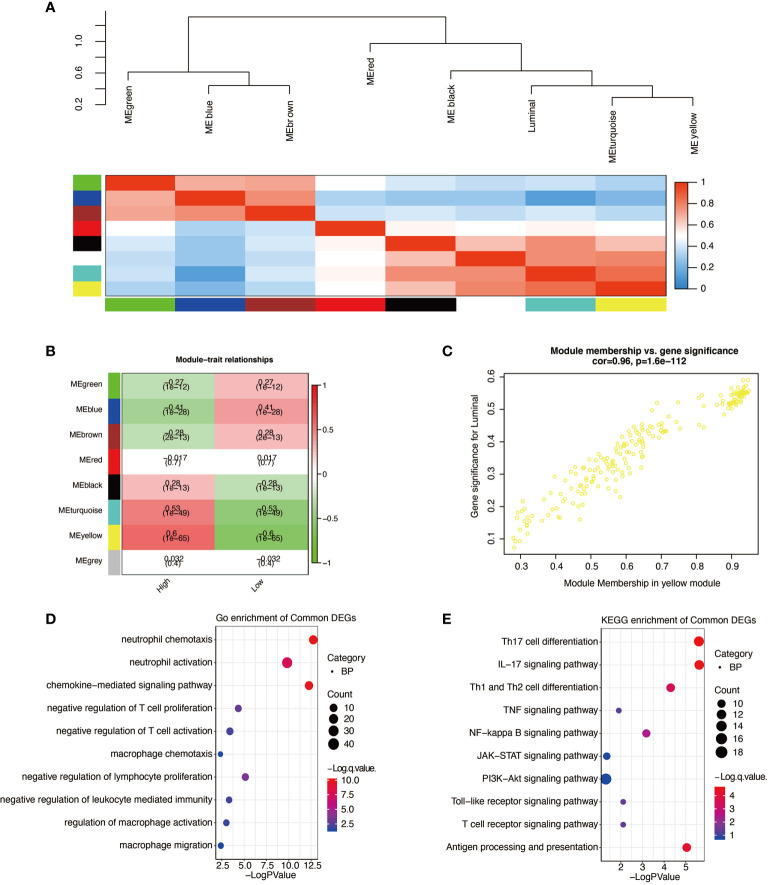
Higher expression of APOBEC3B related gene signature identification. (A) WGCNA was applied to identify the clustered eigengene modules. (B) Seven modules are identified by WGCNA. (C) The yellow module has the highest correlation (r = 0.96, P = 1.6e-112). (D) Go analysis was performed based on APOBEC3Bhigh related genes. (E) KEGG analysis was performed based on APOBEC3B high related genes.

