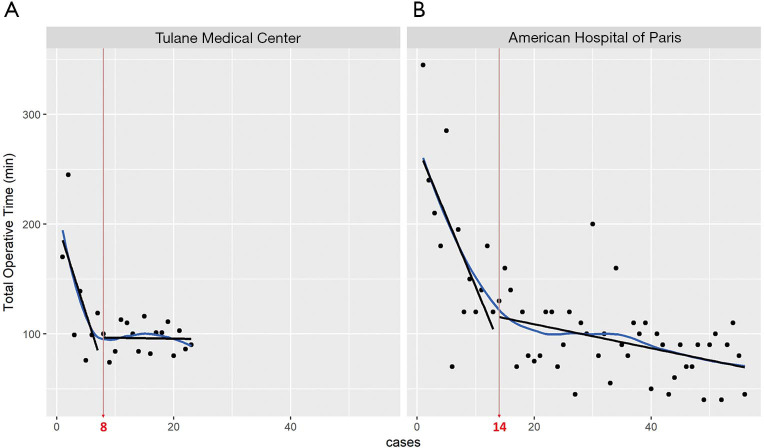
Figure 2.
Learning curve to assess the rate of progression and mastery of the robotic transaxillary parathyroidectomy. X-axis represents the number of cases arranged by order, while the Y-axis represents the time taken during the procedure. As the surgeon learns to operate the robot following the procedural steps, he becomes faster and more proficient at using the machine. Dispersion around the line highlights the variations and outliers. The slopes of learning phase (–16.714x + 202.14 and –13.514x + 274.09, respectively) were compared with the slopes of proficiency phase (–0.0779x + 97.146 and –1.1039x + 131.15, respectively), and they were significantly different (P<0.001).

