

Abstract
Leber’s hereditary optic neuropathy (LHON) is the most common disorder due to mitochondrial DNA mutations and complex I deficiency. It is characterized by an acute vision loss, generally in young adults, with a higher penetrance in males. How complex I dysfunction induces the peculiar LHON clinical presentation remains an unanswered question. To gain an insight into this question, we carried out a non-targeted metabolomic investigation using the plasma of 18 LHON patients, during the chronic phase of the disease, comparing them to 18 healthy controls. A total of 500 metabolites were screened of which 156 were accurately detected. A supervised Orthogonal Partial Least Squares-Discriminant Analysis (OPLS-DA) highlighted a robust model for disease prediction with a Q2 (cum) of 55.5%, with a reliable performance during the permutation test (cross-validation analysis of variance, P-value = 5.02284e−05) and a good prediction of a test set (P = 0.05). This model highlighted 10 metabolites with variable importance in the projection (VIP) > 0.8. Univariate analyses revealed nine discriminating metabolites, six of which were the same as those found in the Orthogonal Projections to Latent Structures Discriminant Analysis model. In total, the 13 discriminating metabolites identified underlining dietary metabolites (nicotinamide, taurine, choline, 1-methylhistidine and hippurate), mitochondrial energetic substrates (acetoacetate, glutamate and fumarate) and purine metabolism (inosine). The decreased concentration of taurine and nicotinamide (vitamin B3) suggest interesting therapeutic targets, given their neuroprotective roles that have already been demonstrated for retinal ganglion cells. Our results show a reliable predictive metabolomic signature in the plasma of LHON patients and highlighted taurine and nicotinamide deficiencies.
Introduction
Leber’s hereditary optic neuropathy (LHON, MIM#535000) is the most common disease caused by mutations in mitochondrial DNA (mtDNA) with a prevalence of about 1/30000 (1). This optic neuropathy is sudden and painless, occurring in young adults on one eye, before affecting the second in the following weeks (2–4). Visual impairment is severe, affecting the central visual field with peripheral vision preserved. The disease is mainly caused by three pathogenic mtDNA variants in genes encoding subunits of the respiratory chain complex I (NADH dehydrogenase). The penetrance is incomplete with male predominance, 50% of men and 20% of women carrying the LHON variants are affected. No curative or preventive treatment is currently available, apart from idebenone®, which slightly improves the condition and avoiding molecules toxic to mitochondria (i.e. alcohol and tobacco) and neurotoxic drugs (5,6). Several clinical trials for future genetic therapies are currently being carried out (7).
In the absence of animal models mimicking human LHON condition, pathophysiological studies have been performed on patients’ fibroblasts, cybrids and recently on induced pluripotent stem cells (8). We have previously shown that LHON fibroblasts carrying the three main mtDNA mutations, i.e. m.3460G > A, m.11778G > A and m.14484 T > C, reduces complex I enzymatic activity by ~50%, reduces the respiratory reserve capacity and reduces the complex I-driven respiratory rate, leading to decreased adenosine triphosphate (ATP) synthesis and partial oxidative phosphorylation (OXPHOS) uncoupling with reduced mitochondrial membrane potential (9–11). Deficiency of ATP synthesis was also reported in trans-mitochondrial cybrids carrying the three main LHON mutations (12), associated with the disruption of glutamate transport and increased production of reactive oxygen species (13,14). The impairment of ATP synthesis was also observed in vivo by 31P-magnetic resonance spectroscopy in the skeletal muscles of LHON patients (15). Cellular models also showed an increased sensitivity to apoptosis and a defect of compensatory mitochondrial biogenesis (16). All these mitochondrial deficiencies suggest a high sensitivity of retinal ganglion cells to energy deficiencies, with their axonal unmyelinated proximal part requiring large amounts of energy to sustain the transduction of the visual information (4).
Few omics studies have been conducted so far in LHON and more generally in mitochondrial disorders. Nevertheless, these data-driven and hypothesis-free approaches disclosed unexpected alterations of cell metabolism, going well beyond the mitochondrial respiration defects. For instance, we, along with others, saw evidence of a generalized stress protein response in patient fibroblasts by transcriptomics (17), metabolomics (11) and proteomics analyses (18,19). Since protein synthesis is one of the most energy-consuming molecular mechanisms (20), it is not surprising that altered mitochondrial energetic metabolism would have an impact on this mechanism.
To date, only two metabolomic studies on LHON have been reported to our knowledge. In a study comparing the metabolomic profiles of 16 fibroblasts from LHON patients with those of eight healthy controls, we identified 38 discriminating metabolites, reduced concentrations of all proteinogenic amino acids, spermidine, putrescine, isovaleryl-carnitine, propionyl-carnitine and five sphingomyelin species, together with increased concentrations of 10 phosphatidylcholine species (11). The importance of sphingomyelins and phosphatidylcholines in LHON signature, together with the decreased amino acid pool, was suggestive of an endoplasmic reticulum (ER) stress that we confirmed using four biomarkers. In addition, we showed that the ER stress in these patient fibroblasts was pharmacologically reversible, opening possible therapeutic interventions (11). The second study used nuclear magnetic resonance (NMR) to compare the metabolomic profiles of five LHON patients with those of four healthy individuals (21). It also evidenced decreased concentrations of amino acids and increased concentrations of fatty acids and phospholipids, which were partially reversed by an idebenone treatment (21).
In this article, we determined the metabolomic signature from the plasma of LHON patients using a validated nontargeted metabolomics approach previously used to characterize the plasma metabolomics signatures of primary open angle glaucoma (22) and OPA1-related dominant optic atrophy (23).
Results
Identification of 156 accurately measured metabolites
Of the 500 metabolites analysed by our metabolomics workflow (Fig. 1), 156 were accurately detected and quantified, using both positive and negative ionization modes. MS/MS fragmentation matching was possible for >75% of the detected metabolites. For the others, identification was further based on the isotopic pattern and the retention time (RT). The most important classes of molecules detected included amino acids (>30%), fatty acids and purines (>5%). The remaining metabolites belonged to carboxylic, indole, keto acid, benzene, amine, hydroxyl acid and purine nucleoside families.
Figure 1.
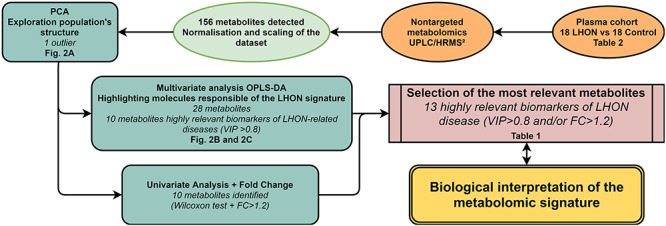
Metabolomics workflow. Steps of sample processing and statistical analysis are indicated with the corresponding figure or table number in bold type. Key elements of the principal features are shown in italics.
LHON signature
The non-supervised PCA approach (Fig. 2a) highlighted an outlier (red circle), probably due to an analytical or experimental bias. It was excluded from the metabolomics datasets during the subsequent statistical analyses. A supervised OPLS-DA model comprising only metabolites with a robust ability of discrimination and a high statistical reliability was then identified (Fig. 2b). This model was based on 28 molecules and disclosed a good predictive ability of 55.5% for Q2(cum) and reliable performances during the permutation test (for 200 permutations, R2: (0.0; 0.393); Q2: (0.0, −0.537)), CV-ANOVA test (P-value = 5.02284e−05) and good prediction of a test set (n = 6; correct at 100%; Fisher’s combined probability test = 0.05). The 10 most discriminant metabolites (VIP > 0.8; P(corr) > +/−0.30) contributing to the predictive model are presented in a Volcano plot (Fig. 2c) and in Table 1.
Figure 2.
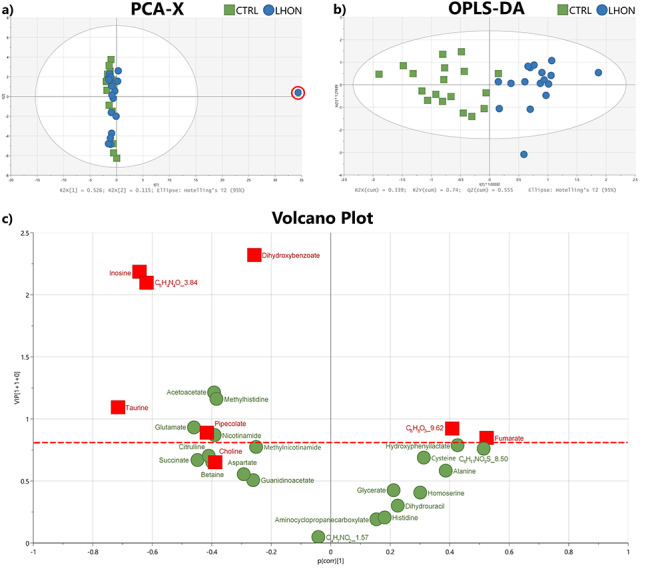
LHON metabolomic signature. (a) Unsupervised PCA score plot of LHON (blue circles) and CTRL (control) (green squares) individuals. An outlier is highlighted (red circle). (b) Supervised OPLS-DA score plot of LHON (blue circle, n = 17) and CTRL (green squares, n = 18) individuals. The model, constructed with 28 molecules (shown in c) discriminates LHON patients on the t [1]*1.02032 axis. (c) VIP plot showing the contribution of each metabolite to the model (described in b). Molecules emphasized in red squares were significant during univariate analysis (Wilcoxon test and FC > 1.2). The horizontal red dotted line corresponds to the threshold of VIP = 0.8.
Table 1.
The 13 most discriminant metabolites of the LHON signature
| Metabolite | Class | VIP value | P(corr) value | FC | P-value |
|---|---|---|---|---|---|
| Inosine | Purines | 2.17 | −0.64 | 0.36 | 0.00382 |
| C5H4N4O_3.84 | Purines | 2.09 | −0.61 | 0.39 | 0.00749 |
| Acetoacetate | Keto acids | 1.21 | −0.39 | NS | NS |
| Methylhistidine | Amino acids | 1.16 | −0.38 | NS | NS |
| Taurine | Organosulfonic acids | 1.09 | −0.71 | 0.79 | 0.00029 |
| Glutamate | Amino acids | 0.93 | −0.45 | NS | NS |
| C8H8O3_9.62 | Benzene | 0.92 | 0.40 | 1.35 | 0.02239 |
| Pipecolate | Amino acids | 0.88 | −0.41 | 0.81 | 0.0349 |
| Nicotinamide | Pyridines | 0.86 | −0.38 | NS | NS |
| Fumarate | Carboxylic acids | 0.84 | 0.52 | 1.22 | 0.01689 |
| Choline | Cholines | < 0.8 | −0.38 | 0.83 | 0.04130 |
| Hippurate | Benzene | NDM | NFDM | 0.78 | 0.02685 |
| C10H13N5O5_3.81 | Purine nucleosides | NDM | NFDM | 0.26 | 0.00339 |
Molecules found to be significant during univariate analysis and/or relevant during the multivariate analysis were put in descending order of VIP value obtained with the OPLS-DA model and FC (Fold Change) value (ratio between the mean values of LHON and control cohorts). For each metabolite, the table shows the corresponding chemical family, the p-value obtained in the univariate analysis after the Wilcoxon test and the P(corr) value in the OPLS-DA model (Fig. 1C). NS, not significant; NDM, not discriminant in the model.
A univariate analysis performed on the 156 accurately detected metabolites revealed nine molecules, with a FC higher than 1.2 and a significant Wilcoxon test, summarized in Table 1 showing the 13 most discriminant metabolites identified by both uni- and multi-variate analyses. Only taurine remained significant after Bonferoni correction. The observation that some variables with a VIP > 0.8 are not found to be significantly different by univariate analyses could be due to the fact that these variables (metabolite concentrations), can potentiate each other in multivariate analyses.
Discussion
We previously used a targeted metabolomic approach, allowing the quantification of 188 metabolites, to characterize the LHON signature in patient’s fibroblasts (11), but this approach was unable to identify discriminant metabolite variations in the plasma of LHON patients compared to healthy controls. Therefore, we analyzed these plasmas with a non-targeted metabolomic approach, allowing the semi-quantification of 500 metabolites, a method which previously allowed us to characterize a metabolomic signature in the plasma of patients with OPA1-related dominant optic atrophy and primary open angle glaucoma (23,24). A predictive multivariate model and significant variations of metabolites were obtained with this non-targeted approach in the plasma of LHON patients.
Among the 13 most discriminant deregulated metabolites identified here, several have already been reported in the metabolomic signatures of mitochondrial diseases, namely glutamate, acetoacetate, fumarate, taurine, choline, inosine and nicotinamide (25).
Acetoacetate, glutamate and fumarate are key metabolites feeding the Krebs cycle, whose altered concentrations in LHON probably reflect a consequence or a metabolic adaptation to the complex I deficiency, which is a feature of the disease. Interestingly, the glutamate concentration was also decreased in the plasma of patients with dominant optic atrophy (23), but not those with glaucoma (24). It is well established that oxidative stress resulting from complex I inhibition is responsible for an alteration of glutamate uptake, both in primary retinal cultures and LHON cybrids (26,27), thus explaining its systemic deregulation in LHON plasma.
Pipecolate, choline and taurine were shown to be low in the liver of a murine model of complex I deficiency (28). Pipecolate is an intermediate from lysine catabolism that partially takes place in mitochondria, and is a biomarker of peroxisome biogenesis disorders. To our knowledge, it has not been associated with LHON so far, although it could be involved in LHON pathophysiology by its impact on cell survival during oxidative stress (29).
Hippurate, and possibly the not-fully-identified C8H8O3_9.62 benzenoid too, results from the hepatic mitochondrial metabolism of polyphenols provided by food and intestinal microbiota. With its synthesis supported by glutamate (30), the reduced concentration of glutamate may explain its decreased concentration in the plasma. The role played by hippurate and more generally by polyphenols metabolism, benzene molecules and intestinal microbiota in LHON pathophysiology remains an unanswered question that our results may prompt an exploration.
The concentration of methylhistidine was strongly increased in the plasma of LHON patients as reported previously in a heterogeneous set of primary mitochondrial disorders, not including LHON patients, compared to healthy controls (31). It is more precisely the 1-methylhistidine that we have measured in this study. 1-methylhistidine is synthesized in the skeletal muscles in animals but not in humans (32). It is therefore considered as a biomarker of meat consumption, while 3-methylhistidine, present in both human and animal muscles, is rather considered as a biomarker of impaired muscle protein turnover and degradation.
Choline is an essential nutrient contributing to the synthesis of phosphatidylcholines that we previously found strongly altered in LHON fibroblasts, as a result of an ER stress, affecting phospholipids synthesis (11). Interestingly, complex I inhibition by rotenone in cultured muscle cells also showed a significant reduction of choline concentration in the culture media, paralleling a reduced concentration of inosine (33).
Inosine, as well as the not fully identified C10H13N5O5_3.81 and C5H4N4O_3.84, are all lowered in LHON and involved in purine metabolism. Such a deregulation of the purine metabolism was also evidenced both in dominant optic atrophy (23,34) and primary open angle glaucoma (22), which reinforces the hypothesis of a common pathophysiological core mechanism linking these mitochondrial-related optic neuropathies. These alterations of the purine metabolism may also reflect more generally a mitochondrial dysfunction, as they were also evidenced in another mitochondrial neurodegenerative disorder due to DNMT1 mutations (35).
The decreased concentration of nicotinamide, a component of vitamin B3, is particularly interesting, since we have already reported such deficiency in OPA1-related dominant optic atrophy (23) and glaucoma (24). These two optic nerve diseases share a systemic impairment of complex I (9,36,37), which suggests an overconsumption of nicotinamide to provide the NAD/NADH (nicotinamide adenine dinucleotide) redox couple that supplies electrons to complex I (NADH dehydrogenase). Vitamin B3 deficiency leads to the use of an attractive therapeutic target, aiming to compensate its overconsumption. The efficacy of this therapeutic strategy on the optic nerve has already been reported in a mouse model of glaucoma (38). Interestingly, reduced blood concentrations of nicotinamide and taurine were also evidenced in cohorts of patients with mitochondrial diseases (25), but not including LHON, which reinforces the interest of these biomarkers and their potential larger therapeutic perspectives.
Taurine, a sulfured amino acid (2-aminoethanesulfonic acid) mainly provided by alimentation, is the most significant metabolites detected here in univariate analysis, with a 25% reduction of its concentration in the plasma of LHON patients. To our knowledge such taurine deficiency in the plasma, not found previously in dominant optic atrophy (23) and glaucoma (22), has not been associated with LHON until now. However, we have previously shown a sharp drop in the concentration of taurine in the aqueous humor of patients with glaucoma where taurine is considered to play an osmolytic role (39). We also previously found a drop in taurine concentration in mouse embryonic fibroblasts in which OPA1 gene has been inactivated and have found that the severity of the OPA1 was tightly correlated to the taurine level in these cells (40). Taurine is present in high concentration in oxidative tissues, where it plays a role in stabilizing the inner mitochondrial membrane gradient and the equilibrium between NAD/NADH and GSH/GSSG (oxidized and reduced forms of glutathione) (41). Interestingly, we have recently reported a profound impact of the glutathione redox imbalance in LHON fibroblasts associated with the increased oxidative stress and at the origin of an increased level of glutathionyled proteins (19). Taurine is also a cytoprotective nutriment that ensures normal complex I and ER functions, both of which are altered in LHON (11,19,42). The taurine deficiency may be an attractive therapeutic target given its protective properties, especially since such protective effect has already been demonstrated in the retina (43). Indeed, taurine is one of the most abundant amino acid in ocular tissues and its experimental depletion in animal models cause retinal ganglion cell degeneration that can reversed by supplementation (43).
Two limitations of this study are the small number of samples analyzed and the patient age heterogeneity. However, the systemic complex I impairment is undoubtedly at the source of the relatively high metabolic discriminating power obtained. The sex bias due to the increased prevalence of the disease in males could also be a limitation, although the male predominance in the cohort probably reduces the metabolic diversity due to sexual dimorphism. Another limitation of our study is that it focused on the chronic phase of the disease, far after the acute phase of visual acuity loss, although the systemic complex I deficit remains persistent at this stage. Indeed, the metabolomic profiles at the acute phase of the disease could be more informative on the pathomechanisms responsible for triggering the loss of vision. Another limitation is the absence in our study of a group of asymptomatic carriers of LHON mutations, which could provide clues about specific metabolic alterations responsible for the incomplete penetrance of the disease. Further studies on larger cohorts including asymptomatic carriers and acute phase are needed to confirm the role of taurine and nicotinamide deficiencies in LHON pathophysiology, and highlight their potential therapeutic values.
Overall, the plasma signature of LHON identified here and summarized in Figure 3 shows metabolites related to dietary intake such as vitamin B3, taurine, choline, 1-methylhistidine and hippurate, which may reflect an upstream adaptation of the energy metabolism to complex I dysfunction. Similarly, the variations of the concentrations of energetic substrates of the Krebs cycle (acetoacetate, glutamate and fumarate) probably reflect the energetic deficiency of LHON mitochondria that could jeopardize retinal ganglion cells’ survival. In this respect, taurine and nicotinamide constitute attractive therapeutic targets, given their neuroprotective role already demonstrated in retinal ganglion cells. Finally, despite their phenotypic and pathophysiological differences, LHON, OPA1-related dominant optic atrophy and glaucoma share common metabolic features, such as nicotinamide deficiency and deregulation of purine metabolism, pointing to a common metabolic susceptibility of retinal ganglion cells in optic neuropathies.
Figure 3.
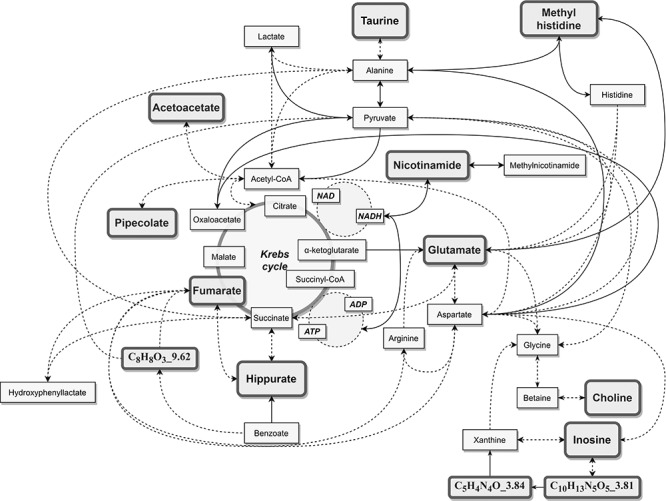
Metabolic position of the LHON discriminant metabolites.
Materials and Methods
Chemicals and reagents
All the isotope standards (17α-hydroxyprogesterone-d8 (2,24,6,6,21,21,21-d8), L-thyroxyne-13C6, succinic acid-2,2,3,3-d4, pyruvic acid-113C and DL-alanine-15N with > 98% purity) were purchased from Sigma Aldrich (St-Quentin Fallavier, France). Formic acid, methanol (MeOH) and water (optima LC/MS grade) were from Fisher Scientific (Illkirch, France).
Study participants
In accordance with the Declaration of Helsinki, the study was approved by the Ethical Committee of the University Hospital of Angers (Comité de Protection des Personnes CPP Ouest II, Angers, France; identification number: CPP CB 2014/02; declaration number: DC-2011-1467; authorization number: AC-2017-2993). All participants provided a written informed consent. Eighteen plasma samples from LHON patients in the chronic phase of the disease with severe visual impairment and carrying a mtDNA pathogenic variant were compared to 18 plasma samples obtained from healthy subjects. The individuals were recruited from March 2016 to May 2019 in the Department of Ophthalmology of the European Hospital Georges Pompidou, Paris, France. No comorbidity was found in our cohort and five patients were on Raxone®. Genotype and phenotype features of patients are summarized in Table 2. There was no statistical significance between LHON and control groups in respect of sex and age (Fisher’s and Wilcoxon test).
Table 2.
LHON and control subjects
| LHON | Control | p-value | |
|---|---|---|---|
| n = 18 | n = 18 | ||
| Sex (M/F) | 14/4 | 14/4 | 1 |
| Mean Age (years, range) | 43 (21–71) | 44 (15–70) | 0.92 |
| Mean delay from onset (years, range) | 14.3 (2–39) | NA | |
| LHON mtDNA pathogenic variant | m.3460G > A (n = 3) | ||
| m.11778G > A (n = 14) | NA | NA | |
| m.14482C > A (n = 1) | |||
| Raxone® | n = 5 | NA | NA |
NA, not applicable.
Plasma sampling
Blood samples from fasting subjects were collected in heparin tubes and transported on ice to the Centre de Ressources Biologiques of the European Hospital Georges Pompidou, Paris, France. Plasma were recovered after centrifugation at +4°C prior to storage at −80°C in aliquots. Samples were later transferred in dry ice to the Centre de Ressources Biologiques of the University Hospital of Angers, France, and conserved at −80°C, before a metabolomic analysis was carried out on them.
Metabolomics analysis
We used a validated non-targeted reverse-phase (RP) method enabling the analysis of around 500 polar metabolites (44) Briefly, ice-cold MeOH was added to 30 μl plasma fortified with the isotope metabolite standards mixture (10 μg/ml in MeOH). After agitation and centrifugation, supernatants were evaporated to leave a dry mixture, which was reconstituted with an aqueous solution (2% MeOH). An additional centrifugation was performed prior to injection on a Dionex Ultimate 3000 ultra‑high-pressure liquid chromatography (UHPLC, Dionex, Sunnyvale, CA, USA) coupled with a Thermo Scientific Q Exactive high-resolution mass spectrometer (HRMS, Thermo Fisher Scientific, Bremen, Germany) equipped with a heated electrospray (HESI II). The chromatography elution was carried out on an Acquity CSH C18 1.7 μm 150 mm × 2.1 column coupled with the precolumn CSH C18 1.7 μm VanGuard (Waters, Guyancourt, France) and acquisitions were performed in positive and negative ionizations modes. Plasmas were injected in accordance to the several quality control (QC) measures prepared by pooling the study population and they processed in exactly the same way as the other samples. To assess the signal’s linearity, QC dilution series (1, 1/2, 1/4) were also carried out. A test set (n = 6) was also created combining samples, according to their phenotype.
A TraceFinder 4.1 (Thermo Fischer Scientific, Inc., Watham, MA, USA) processing method based on our in-house library was used to facilitate metabolite identification and peak integration. The following criteria were used: a coefficient of variation (CV) in QC below 30%, an accurate m/z measurement with delta ppm under 15, a coherent isotopic pattern, a retention time (RT) drift lower than 10 s, a good linearity with an r2 higher than 0.7 and, where possible, more than two fragments identified in fragmentation experiences. In cases where the metabolite could not be identified using these criteria (level of metabolite identifications: 1, identified compounds) or similarities to data stored on our library were observed (i.e. fragmentation matching to another RT), molecules were named by their chemical formula and RT (level of metabolite identification: 2, putatively annotated compounds) (45).
Data statistical analyses
Data analyses were performed according to the workflow diagram shown in Figure 1. To avoid any instrumental drift, data were first normalized using the LOESS regression function available at galaxy.workflow4metabolomics.org (46). Afterwards, in order to reduce the inter-individual variation, an additional normalisation to the MS Total Useful Signal (MSTUS) was applied using Microsoft Excel Software (Microsoft Corp., Redmond, WA, USA). Moreover, the dataset was log10 transformed, then mean-centred and scaled by the square root of the standard deviation of each variable (Pareto scaling) to reduce the contribution from the most intense ions.
Multivariate analyses were carried out with Simca-P + v 16.0 software (Umetrics, Umea, Sweden). The unsupervised Principal Component Analysis (PCA) was used to investigate the population structure while the supervised Orthogonal Partial Least Squares Discriminant Analysis (OPLS-DA) was performed to highlight discriminant molecules implicated in the metabolomics signature. To minimize the risk of overfitting and to ensure the robustness of the prediction, variables were gradually excluded according to results obtained from different plots (S-plot, loading column plot, coefficient plot and Variable Importance in the Projection (VIP) plot), keeping only metabolites that exhibited a strong power of discrimination and a high statistical reliability. OPLS-DA model was cross-validated by leaving one-seventh of the samples, and the process was replicated seven times. The quality and performances of the model were evaluated using the Q2Ycum (goodness of the prediction), the R2Ycum (goodness of the fit) values, the cross-validation analysis of variance (CV-ANOVA), the permutation test (evaluation of the risk of over-fitting) and the prediction of a test set (six test samples prepared and analysed like the others but not used for the construction of the model). Finally, only metabolites with a VIP value greater than 0.8 were considered relevant for the metabolomics fingerprinting.
Univariate analyses were performed on MetaboAnalyst 4.0 that allowed, through its Volcano plot module, to highlight only molecules with a fold change (FC) higher than 1.2 combined to a Wilcoxon test at 0.05 threshold.
Conflict of interest statement: The authors have no conflict of interest.
Acknowledgments
We are thankful to the individuals participating in this study.
Contributor Information
Cinzia Bocca, Unité Mixte de Recherche (UMR) MITOVASC, Centre National de la Recherche Scientifique (CNRS) 6015, Institut National de la Santé et de la Recherche Médicale (INSERM) U1083, Université d'Angers, 49933 Angers, France; Département de Biochimie et Génétique, Centre Hospitalier Universitaire, 49933 Angers, France.
Victor Le Paih, Unité Mixte de Recherche (UMR) MITOVASC, Centre National de la Recherche Scientifique (CNRS) 6015, Institut National de la Santé et de la Recherche Médicale (INSERM) U1083, Université d'Angers, 49933 Angers, France.
Juan Manuel Chao de la Barca, Unité Mixte de Recherche (UMR) MITOVASC, Centre National de la Recherche Scientifique (CNRS) 6015, Institut National de la Santé et de la Recherche Médicale (INSERM) U1083, Université d'Angers, 49933 Angers, France; Département de Biochimie et Génétique, Centre Hospitalier Universitaire, 49933 Angers, France.
Judith Kouassy Nzoughet, Faculté de Pharmacie de Paris, Université de Paris, CiTCoM, CNRS, F-75006 Paris, France.
Patrizia Amati-Bonneau, Unité Mixte de Recherche (UMR) MITOVASC, Centre National de la Recherche Scientifique (CNRS) 6015, Institut National de la Santé et de la Recherche Médicale (INSERM) U1083, Université d'Angers, 49933 Angers, France; Département de Biochimie et Génétique, Centre Hospitalier Universitaire, 49933 Angers, France.
Odile Blanchet, Centre de Ressources Biologiques, BB-0033-00038, Centre Hospitalier Universitaire, 49933 Angers, France.
Benoit Védie, Plateformes Centre de Ressources Biologiques et Tumorothèque, BB-0033-00063, Hôpital Européen Georges Pompidou, Paris, France; Hôpital Européen Georges Pompidou, Département de Biochimie, Assistance Publique - Hôpitaux de Paris (AP-HP), Université Paris Descartes, Paris, France.
Daniela Géromin, Plateformes Centre de Ressources Biologiques et Tumorothèque, BB-0033-00063, Hôpital Européen Georges Pompidou, Paris, France.
Gilles Simard, Département de Biochimie et Génétique, Centre Hospitalier Universitaire, 49933 Angers, France.
Vincent Procaccio, Unité Mixte de Recherche (UMR) MITOVASC, Centre National de la Recherche Scientifique (CNRS) 6015, Institut National de la Santé et de la Recherche Médicale (INSERM) U1083, Université d'Angers, 49933 Angers, France; Département de Biochimie et Génétique, Centre Hospitalier Universitaire, 49933 Angers, France.
Dominique Bonneau, Unité Mixte de Recherche (UMR) MITOVASC, Centre National de la Recherche Scientifique (CNRS) 6015, Institut National de la Santé et de la Recherche Médicale (INSERM) U1083, Université d'Angers, 49933 Angers, France; Département de Biochimie et Génétique, Centre Hospitalier Universitaire, 49933 Angers, France.
Guy Lenaers, Unité Mixte de Recherche (UMR) MITOVASC, Centre National de la Recherche Scientifique (CNRS) 6015, Institut National de la Santé et de la Recherche Médicale (INSERM) U1083, Université d'Angers, 49933 Angers, France.
Christophe Orssaud, Unité Fonctionnelle d'Ophtalmologie, CRMR Ophtara, Hôpital Européen Georges Pompidou (HEGP), GH Paris Centre, Assistance Publique - Hôpitaux de Paris (AP-HP), 75015 Paris, France; Service d'Ophtalmologie, Ophtara Hôpital Necker-Enfants Malades, GH Paris Centre, AP-HP, 149, rue de Sèvres, 75015 Paris, France.
Pascal Reynier, Unité Mixte de Recherche (UMR) MITOVASC, Centre National de la Recherche Scientifique (CNRS) 6015, Institut National de la Santé et de la Recherche Médicale (INSERM) U1083, Université d'Angers, 49933 Angers, France; Département de Biochimie et Génétique, Centre Hospitalier Universitaire, 49933 Angers, France.
Funding
The Institut National de la Santé et de la Recherche Médicale (INSERM); the Centre National de la Recherche Scientifique (CNRS); the University of Angers; and the Angers University Hospital; patients’ associations/foundations Ouvrir les Yeux, Fondation VISIO; Kjer France; Retina France; Union nationale des Aveugles et Déficients visuels (UNADEV); and Association contre les Maladies mitochondriales (AMMi).
References
- 1. Mascialino, B., Leinonen, M. and Meier, T. (2011) Meta-analysis of the prevalence of Leber hereditary optic neuropathy mtDNA mutations in Europe. Eur. J. Ophthalmol., 22, 461–465. [DOI] [PubMed] [Google Scholar]
- 2. Milea, D., Amati-Bonneau, P., Reynier, P. and Bonneau, D. (2010) Genetically determined optic neuropathies. Curr. Opin. Neurol., 23, 24–28. [DOI] [PubMed] [Google Scholar]
- 3. Yu-Wai-Man, P., Griffiths, P.G. and Chinnery, P.F. (2011) Mitochondrial optic neuropathies – disease mechanisms and therapeutic strategies. Prog. Retin. Eye Res., 30, 81–114. [DOI] [PMC free article] [PubMed] [Google Scholar]
- 4. La Morgia, C., Carbonelli, M., Barboni, P., Sadun, A.A. and Carelli, V. (2014) Medical Management of Hereditary Optic Neuropathies. Front. Neurol., 5, 141. [DOI] [PMC free article] [PubMed] [Google Scholar]
- 5. Carelli, V., Carbonelli, M., deCoo, I.F., Kawasaki, A., Klopstock, T., Lagrèze, W.A., La Morgia, C., Newman, N.J., Orssaud, C., Pott, J.W.R.et al. (2017) International consensus statement on the clinical and therapeutic management of Leber hereditary optic neuropathy. J. Neuroophthalmol., 37, 371–381. [DOI] [PubMed] [Google Scholar]
- 6. Kogachi, K., Ter-Zakarian, A., Asanad, S., Sadun, A. and Karanjia, R. (2019) Toxic medications in Leber’s hereditary optic neuropathy. Mitochondrion, 46, 270–277. [DOI] [PubMed] [Google Scholar]
- 7. Jurkute, N., Harvey, J. and Yu-Wai-Man, P. (2019) Treatment strategies for Leber hereditary optic neuropathy. Curr. Opin. Neurol., 32, 99–104. [DOI] [PubMed] [Google Scholar]
- 8. Bahr, T., Welburn, K., Donnelly, J. and Bai, Y. (2020) Emerging model systems and treatment approaches for Leber’s hereditary optic neuropathy: challenges and opportunities. Biochim. Biophys. Acta, 1866, 165743. [DOI] [PMC free article] [PubMed] [Google Scholar]
- 9. Chevrollier, A., Guillet, V., Loiseau, D., Gueguen, N., Pou de Crescenzo, M.A., Verny, C., Ferre, M., Dollfus, H., Odent, S., Milea, D.et al. (2008) Hereditary optic neuropathies share a common mitochondrial coupling defect. Ann. Neurol., 63, 794–798. [DOI] [PubMed] [Google Scholar]
- 10. Angebault, C., Gueguen, N., Desquiret-Dumas, V., Chevrollier, A., Guillet, V., Verny, C., Cassereau, J., Ferre, M., Milea, D., Amati-Bonneau, P.et al. (2011) Idebenone increases mitochondrial complex I activity in fibroblasts from LHON patients while producing contradictory effects on respiration. BMC. Res. Notes, 4, 557. [DOI] [PMC free article] [PubMed] [Google Scholar]
- 11. Chao de la Barca, J.M., Simard, G., Amati-Bonneau, P., Safiedeen, Z., Prunier-Mirebeau, D., Chupin, S., Gadras, C., Tessier, L., Gueguen, N., Chevrollier, A.et al. (2016) The metabolomic signature of Leber’s hereditary optic neuropathy reveals endoplasmic reticulum stress. Brain, 139, 2864–2876. [DOI] [PubMed] [Google Scholar]
- 12. Baracca, A., Solaini, G., Sgarbi, G., Lenaz, G., Baruzzi, A., Schapira, A.H.V., Martinuzzi, A. and Carelli, V. (2005) Severe impairment of complex I–driven adenosine triphosphate synthesis in Leber hereditary optic neuropathy cybrids. Arch. Neurol., 62, 730–736. [DOI] [PubMed] [Google Scholar]
- 13. Beretta, S., Mattavelli, L., Sala, G., Tremolizzo, L., Schapira, A.H.V., Martinuzzi, A., Carelli, V. and Ferrarese, C. (2004) Leber hereditary optic neuropathy mtDNA mutations disrupt glutamate transport in cybrid cell lines. Brain, 127, 2183–2192. [DOI] [PubMed] [Google Scholar]
- 14. Wong, A., Cavelier, L., Collins-Schramm, H.E., Seldin, M.F., McGrogan, M., Savontaus, M.-L. and Cortopassi, G.A. (2002) Differentiation-specific effects of LHON mutations introduced into neuronal NT2 cells. Hum. Mol. Genet., 11, 431–438. [DOI] [PubMed] [Google Scholar]
- 15. Lodi, R., Taylor, D.J., Tabrizi, S.J., Kumar, S., Sweeney, M., Wood, N.W., Styles, P., Radda, G.K. and Schapira, A.H.V. (1997) In vivo skeletal muscle mitochondrial function in Leber’s hereditary optic neuropathy assessed by 31P magnetic resonance spectroscopy. Ann. Neurol., 42, 573–579. [DOI] [PubMed] [Google Scholar]
- 16. Giordano, C., Iommarini, L., Giordano, L., Maresca, A., Pisano, A., Valentino, M.L., Caporali, L., Liguori, R., Deceglie, S., Roberti, M.et al. (2014) Efficient mitochondrial biogenesis drives incomplete penetrance in Leber’s hereditary optic neuropathy. Brain, 137, 335–353. [DOI] [PMC free article] [PubMed] [Google Scholar]
- 17. Cortopassi, G., Danielson, S., Alemi, M., Zhan, S.S., Tong, W., Carelli, V., Martinuzzi, A., Marzuki, S., Majamaa, K., Wong, A.et al. (2006) Mitochondrial disease activates transcripts of the unfolded protein response and cell cycle and inhibits vesicular secretion and oligodendrocyte-specific transcripts. Mitochondrion, 6, 161–175. [DOI] [PubMed] [Google Scholar]
- 18. Tun, A.W., Chaiyarit, S., Kaewsutthi, S., Katanyoo, W., Chuenkongkaew, W., Kuwano, M., Tomonaga, T., Peerapittayamongkol, C., Thongboonkerd, V. and Lertrit, P. (2014) Profiling the mitochondrial proteome of Leber’s hereditary optic neuropathy (LHON) in Thailand: down-regulation of bioenergetics and mitochondrial protein quality control pathways in fibroblasts with the 11778G>a mutation. PLoS One, 9, e106779. [DOI] [PMC free article] [PubMed] [Google Scholar]
- 19. Zhou, L., Chan, J.C.Y., Chupin, S., Gueguen, N., Desquiret-Dumas, V., Koh, S.K., Li, J., Gao, Y., Deng, L., Verma, C.et al. (2020) Increased protein S-glutathionylation in Leber’s hereditary optic neuropathy (LHON). Int. J. Mol. Sci., 21, 3027. [DOI] [PMC free article] [PubMed] [Google Scholar]
- 20. Lane, N. and Martin, W. (2010) The energetics of genome complexity. Nature, 467, 929–934. [DOI] [PubMed] [Google Scholar]
- 21. Morvan, D. and Demidem, A. (2018) NMR metabolomics of fibroblasts with inherited mitochondrial complex I mutation reveals treatment-reversible lipid and amino acid metabolism alterations. Metabolomics, 14, 55. [DOI] [PMC free article] [PubMed] [Google Scholar]
- 22. Kouassi Nzoughet, J., Guehlouz, K., Leruez, S., Gohier, P., Bocca, C., Muller, J., Blanchet, O., Bonneau, D., Simard, G., Milea, D.et al. (2020) A data mining metabolomics exploration of glaucoma. Metabolites, 10, 49. [DOI] [PMC free article] [PubMed] [Google Scholar]
- 23. Bocca, C., Kouassi Nzoughet, J., Leruez, S., Amati-Bonneau, P., Ferré, M., Kane, M.-S., Veyrat-Durebex, C., Chao de la Barca, J.M., Chevrollier, A., Homedan, C.et al. (2018) A plasma metabolomic signature involving purine metabolism in human optic atrophy 1 (OPA1)-related disorders. Invest. Opthalmol. Vis. Sci., 59, 185–195. [DOI] [PubMed] [Google Scholar]
- 24. Kouassi Nzoughet, J., Chao de la Barca, J.M., Guehlouz, K., Leruez, S., Coulbault, L., Allouche, S., Bocca, C., Muller, J., Amati-Bonneau, P., Gohier, P.et al. (2019) Nicotinamide deficiency in primary open-angle glaucoma. Invest. Opthalmol. Vis. Sci., 60, 2509–2514. [DOI] [PubMed] [Google Scholar]
- 25. Esterhuizen, K., van derWesthuizen, F.H. and Louw, R. (2017) Metabolomics of mitochondrial disease. Mitochondrion, 35, 97–110. [DOI] [PubMed] [Google Scholar]
- 26. Beretta, S., Wood, J.P.M., Derham, B., Sala, G., Tremolizzo, L., Ferrarese, C. and Osborne, N.N. (2006) Partial mitochondrial complex I inhibition induces oxidative damage and perturbs glutamate transport in primary retinal cultures. Neurobiol. Dis., 24, 308–317. [DOI] [PubMed] [Google Scholar]
- 27. Sala, G., Trombin, F., Beretta, S., Tremolizzo, L., Presutto, P., Montopoli, M., Fantin, M., Martinuzzi, A., Carelli, V. and Ferrarese, C. (2008) Antioxidants partially restore glutamate transport defect in leber hereditary optic neuropathy cybrids. J. Neurosci. Res., 86, 3331–3337. [DOI] [PubMed] [Google Scholar]
- 28. Kim, C., Potluri, P., Khalil, A., Gaut, D., McManus, M., Compton, S., Wallace, D.C. and Yadava, N. (2017) An X-chromosome linked mouse model (Ndufa1 S55A) for systemic partial complex I deficiency for studying predisposition to neurodegeneration and other diseases. Neurochem. Int., 109, 78–93. [DOI] [PubMed] [Google Scholar]
- 29. Natarajan, S.K., Muthukrishnan, E., Khalimonchuk, O., Mott, J.L. and Becker, D.F. (2017) Evidence for pipecolate oxidase in mediating protection against hydrogen peroxide stress. J. Cell. Biochem., 118, 1678–1688. [DOI] [PMC free article] [PubMed] [Google Scholar]
- 30. Gatley, S.J. and Sherratt, H.S. (1977) The synthesis of hippurate from benzoate and glycine by rat liver mitochondria. Submitochondrial localization and kinetics. Biochem. J., 166, 39–47. [DOI] [PMC free article] [PubMed] [Google Scholar]
- 31. Clarke, C., Xiao, R., Place, E., Zhang, Z., Sondheimer, N., Bennett, M., Yudkoff, M. and Falk, M.J. (2013) Mitochondrial respiratory chain disease discrimination by retrospective cohort analysis of blood metabolites. Mol. Genet. Metab., 110, 145–152. [DOI] [PMC free article] [PubMed] [Google Scholar]
- 32. Kochlik, B., Gerbracht, C., Grune, T. and Weber, D. (2018) The influence of dietary habits and meat consumption on plasma 3methylhistidine – a potential marker for muscle protein turnover. Mol. Nutr. Food Res., 62, e1701062. [DOI] [PMC free article] [PubMed] [Google Scholar]
- 33. Shaham, O., Slate, N.G., Goldberger, O., Xu, Q., Ramanathan, A., Souza, A.L., Clish, C.B., Sims, K.B. and Mootha, V.K. (2010) A plasma signature of human mitochondrial disease revealed through metabolic profiling of spent media from cultured muscle cells. Proc. Natl. Acad. Sci. U. S. A., 107, 1571–1575. [DOI] [PMC free article] [PubMed] [Google Scholar]
- 34. Bocca, C., Kane, M.S., Veyrat-Durebex, C., Chupin, S., Alban, J., Kouassi Nzoughet, J., Le Mao, M., Chao de la Barca, J.M., Amati-Bonneau, P., Bonneau, D.et al. (2018) The metabolomic bioenergetic signature of Opa1-disrupted mouse embryonic fibroblasts highlights aspartate deficiency. Sci. Rep., 8, 11528. [DOI] [PMC free article] [PubMed] [Google Scholar]
- 35. Maresca, A., Del Dotto, V., Capristo, M., Scimonelli, E., Tagliavini, F., Morandi, L., Tropeano, C.V., Caporali, L., Mohamed, S., Roberti, M.et al. (2020) DNMT1 mutations leading to neurodegeneration paradoxically reflect on mitochondrial metabolism. Hum. Mol. Genet., 29, 1864–1881. [DOI] [PMC free article] [PubMed] [Google Scholar]
- 36. Zanna, C., Ghelli, A., Porcelli, A.M., Karbowski, M., Youle, R.J., Schimpf, S., Wissinger, B., Pinti, M., Cossarizza, A., Vidoni, S.et al. (2008) OPA1 mutations associated with dominant optic atrophy impair oxidative phosphorylation and mitochondrial fusion. Brain, 131, 352–367. [DOI] [PubMed] [Google Scholar]
- 37. Lee, S., Sheck, L., Crowston, J.G., Bergen, N.J.V., O’Neill, E.C., O’Hare, F., Kong, Y.X.G., Chrysostomou, V., Vincent, A.L. and Trounce, I.A. (2012) Impaired complex-I-linked respiration and ATP synthesis in primary open-angle glaucoma patient lymphoblasts. Invest. Ophthalmol. Vis. Sci., 53, 2431–2437. [DOI] [PubMed] [Google Scholar]
- 38. Williams, P.A., Harder, J.M., Foxworth, N.E., Cochran, K.E., Philip, V.M., Porciatti, V., Smithies, O. and John, S.W.M. (2017) Vitamin B3 modulates mitochondrial vulnerability and prevents glaucoma in aged mice. Science, 355, 756–760. [DOI] [PMC free article] [PubMed] [Google Scholar]
- 39. Buisset, A., Gohier, P., Leruez, S., Muller, J., Amati-Bonneau, P., Lenaers, G., Bonneau, D., Simard, G., Procaccio, V., Annweiler, C.et al. (2019) Metabolomic profiling of aqueous humor in glaucoma points to taurine and spermine deficiency: findings from the eye-D study. J. Proteome Res., 18, 1307–1315. [DOI] [PubMed] [Google Scholar]
- 40. Chao de la Barca, J.M., Fogazza, M., Rugolo, M., Chupin, S., Del Dotto, V., Ghelli, A.M., Carelli, V., Simard, G., Procaccio, V., Bonneau, D.et al. (2020) Metabolomics hallmarks OPA1 variants correlating with their in vitro phenotype and predicting clinical severity. Hum. Mol. Genet., 29, 1319–1329. [DOI] [PMC free article] [PubMed] [Google Scholar]
- 41. Hansen, S.H., Grunnet, N. Taurine, Glutathione and bioenergetics. In: Idrissi A, L’Amoreaux WJ, editor(s). Taurine 8. New York, NY: Springer New York; 2013. p. 3–12 [Google Scholar]
- 42. Jong, C., Ito, T., Prentice, H., Wu, J.-Y. and Schaffer, S. (2017) Role of mitochondria and endoplasmic reticulum in taurine-deficiency-mediated apoptosis. Nutrients, 9, 795. [DOI] [PMC free article] [PubMed] [Google Scholar]
- 43. Froger, N., Moutsimilli, L., Cadetti, L., Jammoul, F., Wang, Q.-P., Fan, Y., Gaucher, D., Rosolen, S.G., Neveux, N., Cynober, L.et al. (2014) Taurine: the comeback of a neutraceutical in the prevention of retinal degenerations. Prog. Retin. Eye Res., 41, 44–63. [DOI] [PubMed] [Google Scholar]
- 44. Kouassi Nzoughet, J., Bocca, C., Simard, G., Prunier-Mirebeau, D., Chao de la Barca, J.M., Bonneau, D., Procaccio, V., Prunier, F., Lenaers, G. and Reynier, P. (2017) A nontargeted UHPLC-HRMS metabolomics pipeline for metabolite identification: application to cardiac remote ischemic preconditioning. Anal. Chem., 89, 2138–2146. [DOI] [PubMed] [Google Scholar]
- 45. Sumner, L.W., Amberg, A., Barrett, D., Beale, M.H., Beger, R., Daykin, C.A., Fan, T.W.-M., Fiehn, O., Goodacre, R., Griffin, J.L.et al. (2007) Proposed minimum reporting standards for chemical analysis: chemical analysis working group (CAWG) metabolomics standards initiative (MSI). Metabolomics, 3, 211–221. [DOI] [PMC free article] [PubMed] [Google Scholar]
- 46. van der Kloet, F.M., Bobeldijk, I., Verheij, E.R. and Jellema, R.H. (2009) Analytical error reduction using single point calibration for accurate and precise Metabolomic phenotyping. J. Proteome Res., 8, 5132–5141. [DOI] [PubMed] [Google Scholar]