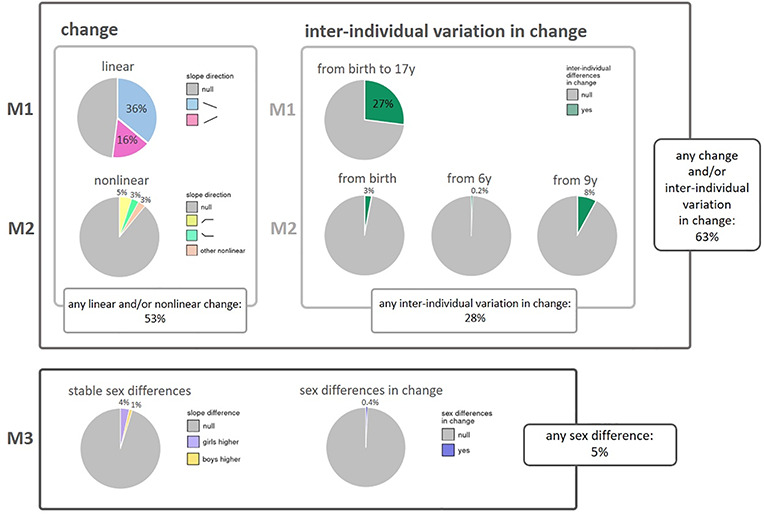
Figure 4.

Overview of results from the three models. Model 1 (M1) was applied for overall change in DNA methylation and inter-individual variation in linear change; Model 2 (M2) for non-linear change in DNA methylation and inter-individual variation in non-linear change; and Model 3 (M3) for stable sex differences in DNA methylation and sex differences in change of DNA methylation (sex by time interaction). Percentages represent percentage of autosomal CpGs below Bonferroni-corrected threshold (P < 1 × 10⁻⁷).
