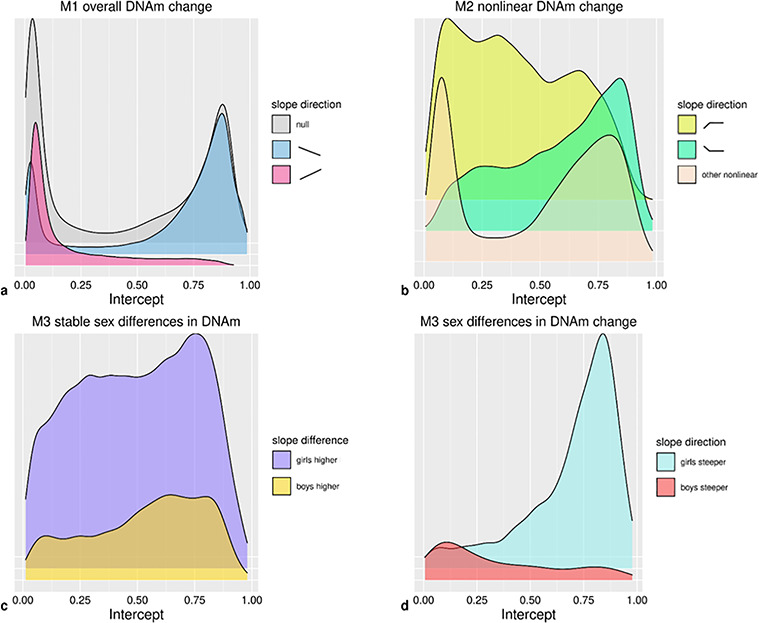
Figure 5.

Density plots of intercepts for CpGs with (a) directions of change in Model 1 (n = 473 864); (b) non-linear trajectories in Model 2 (n = 52 043); (c) stable sex differences in Model 3 (n = 22 821); (d) sex differences in DNAm change in Model 3 (n = 1768).
