
Figure 2.
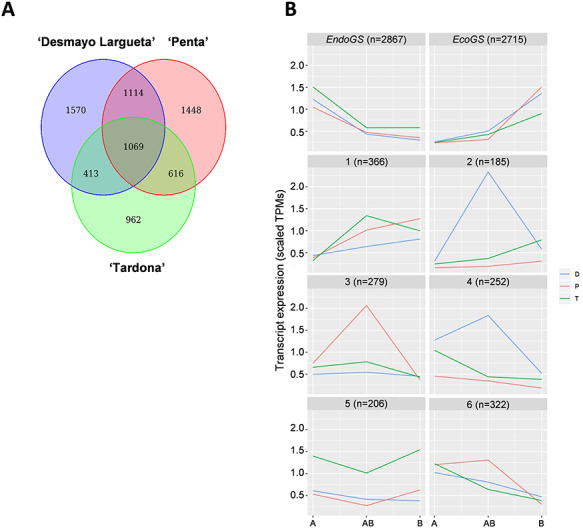
Almond DEGs identified during dormancy release (A, AB, B samples) in the three cultivars of study. (A) Common and specific DEGs among cultivars represented by a Venn diagram. (B) DEGs clusters represented by scaled TPM of genes included within each cluster. The number of genes per cluster (n) is indicated. Endodormant and Ecodormant Genes Superclusters are considered EndoGS and EcoGS, respectively. The extra-early flowering Desmayo Largueta cultivar (‘D’) is in blue; the extra-late flowering Penta cultivar (‘P’) is in red and the ultra-late flowering Tardona cultivar (‘T’) is in green.