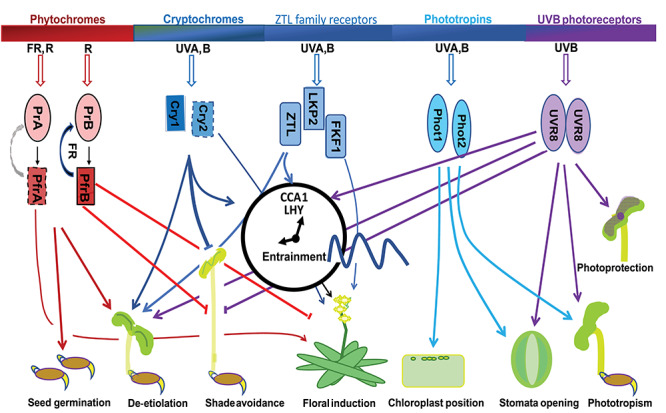
Figure 1.

A schematic outline of plant photoreception across the light spectrum. Coloured lines indicate the contributions of each photoreceptor to plant development and responses. Activated phytochrome A (PfrA) and cryptochrome 2 (cry2) are highly unstable (indicated by dashed outlines or grey arrow), unlike other activated phytochromes or cryptochrome 1 (cry1). Arrows suggest a promotive interaction while bars indicate a repression of the activity.
