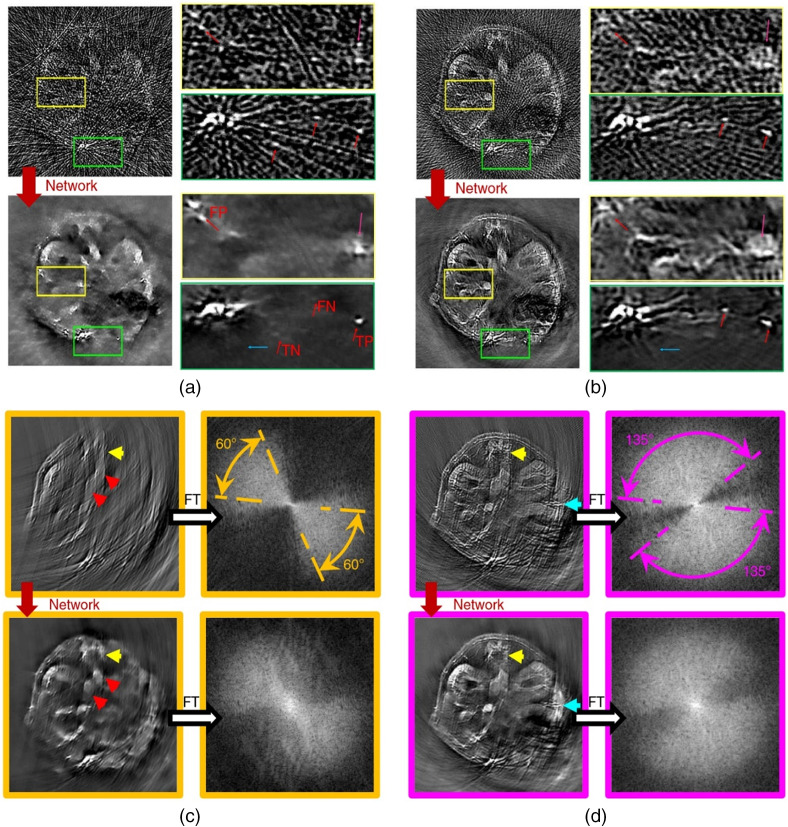
Fig. 4.
The results of Davoudi et al.’s method. (a) Reconstructed image with under sampled (32 projections) data versus its artifact-free counterpart obtained with the trained network. TP, true positive; FP, false positive; TN, true negative; and FN, false negative. (b) Another example for under sampled data with 128 projections. (c) Top: image reconstructed with 60-deg angular coverage and its respective amplitude spectrum. Bottom: output image of the network and its corresponding amplitude spectrum. (d) Top: image reconstructed with 135-deg angular coverage and its respective amplitude spectrum. Bottom: output image of the network and its corresponding amplitude spectrum.

