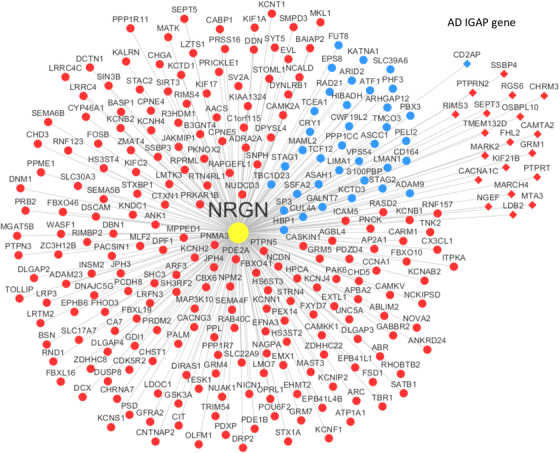
FIGURE 1.

Neurogranin (NRGN)‐centered gene co‐expression network. The network includes the 263 genes significantly correlated with NRGN by Spearman correlation analysis (Benjamini‐Hochberg correction P < 0.01). Nodes in red indicate the genes positively correlated with NRGN while those in blue represent genes positively correlated with NRGN. The nodes in the diamond shape are the Alzheimer's disease risk genes identified by the International Genomics of Alzheimer's Project (IGAP)
