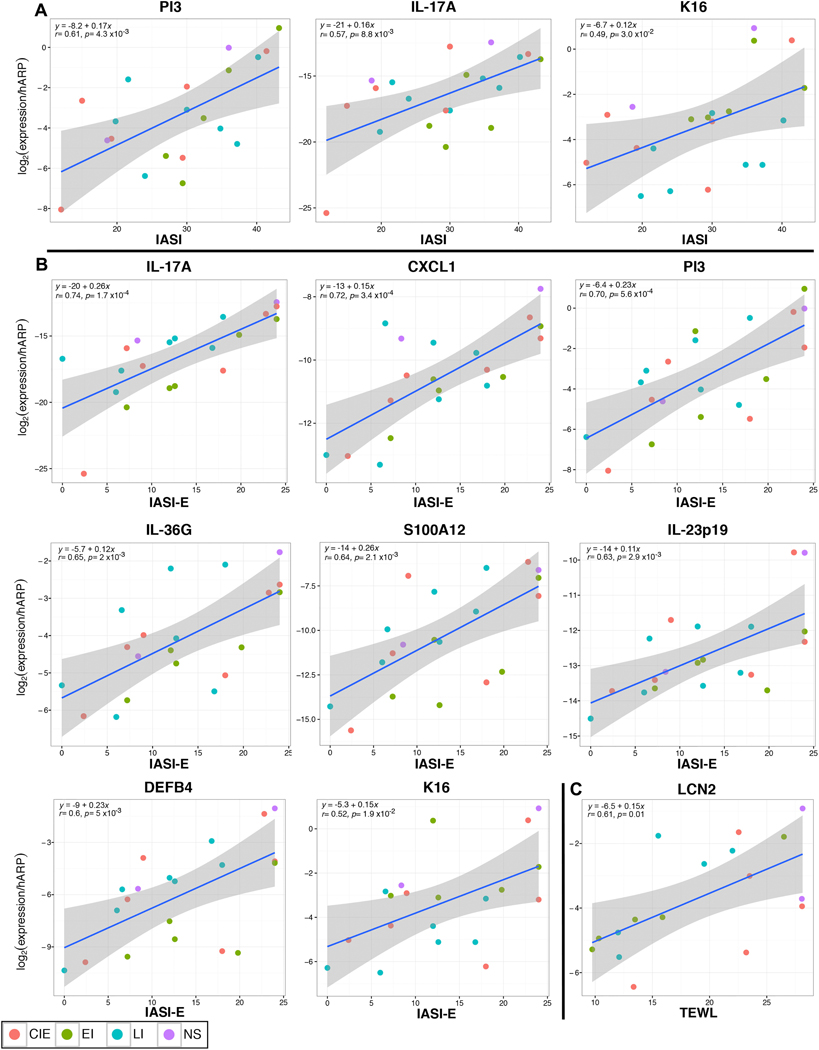
Figure 5.
Pearson correlation plots of the mRNA gene expression that correlated highest with (A) overall clinical severity score (IASI), (B) erythema severity subscore (IASI-E), and (C) TEWL in ichthyosis subtypes. r = Pearson correlation-coefficient with associated p value (p). y = equation for linear regression (blue line) with its confidence interval (smoothed confidence interval in grey).

