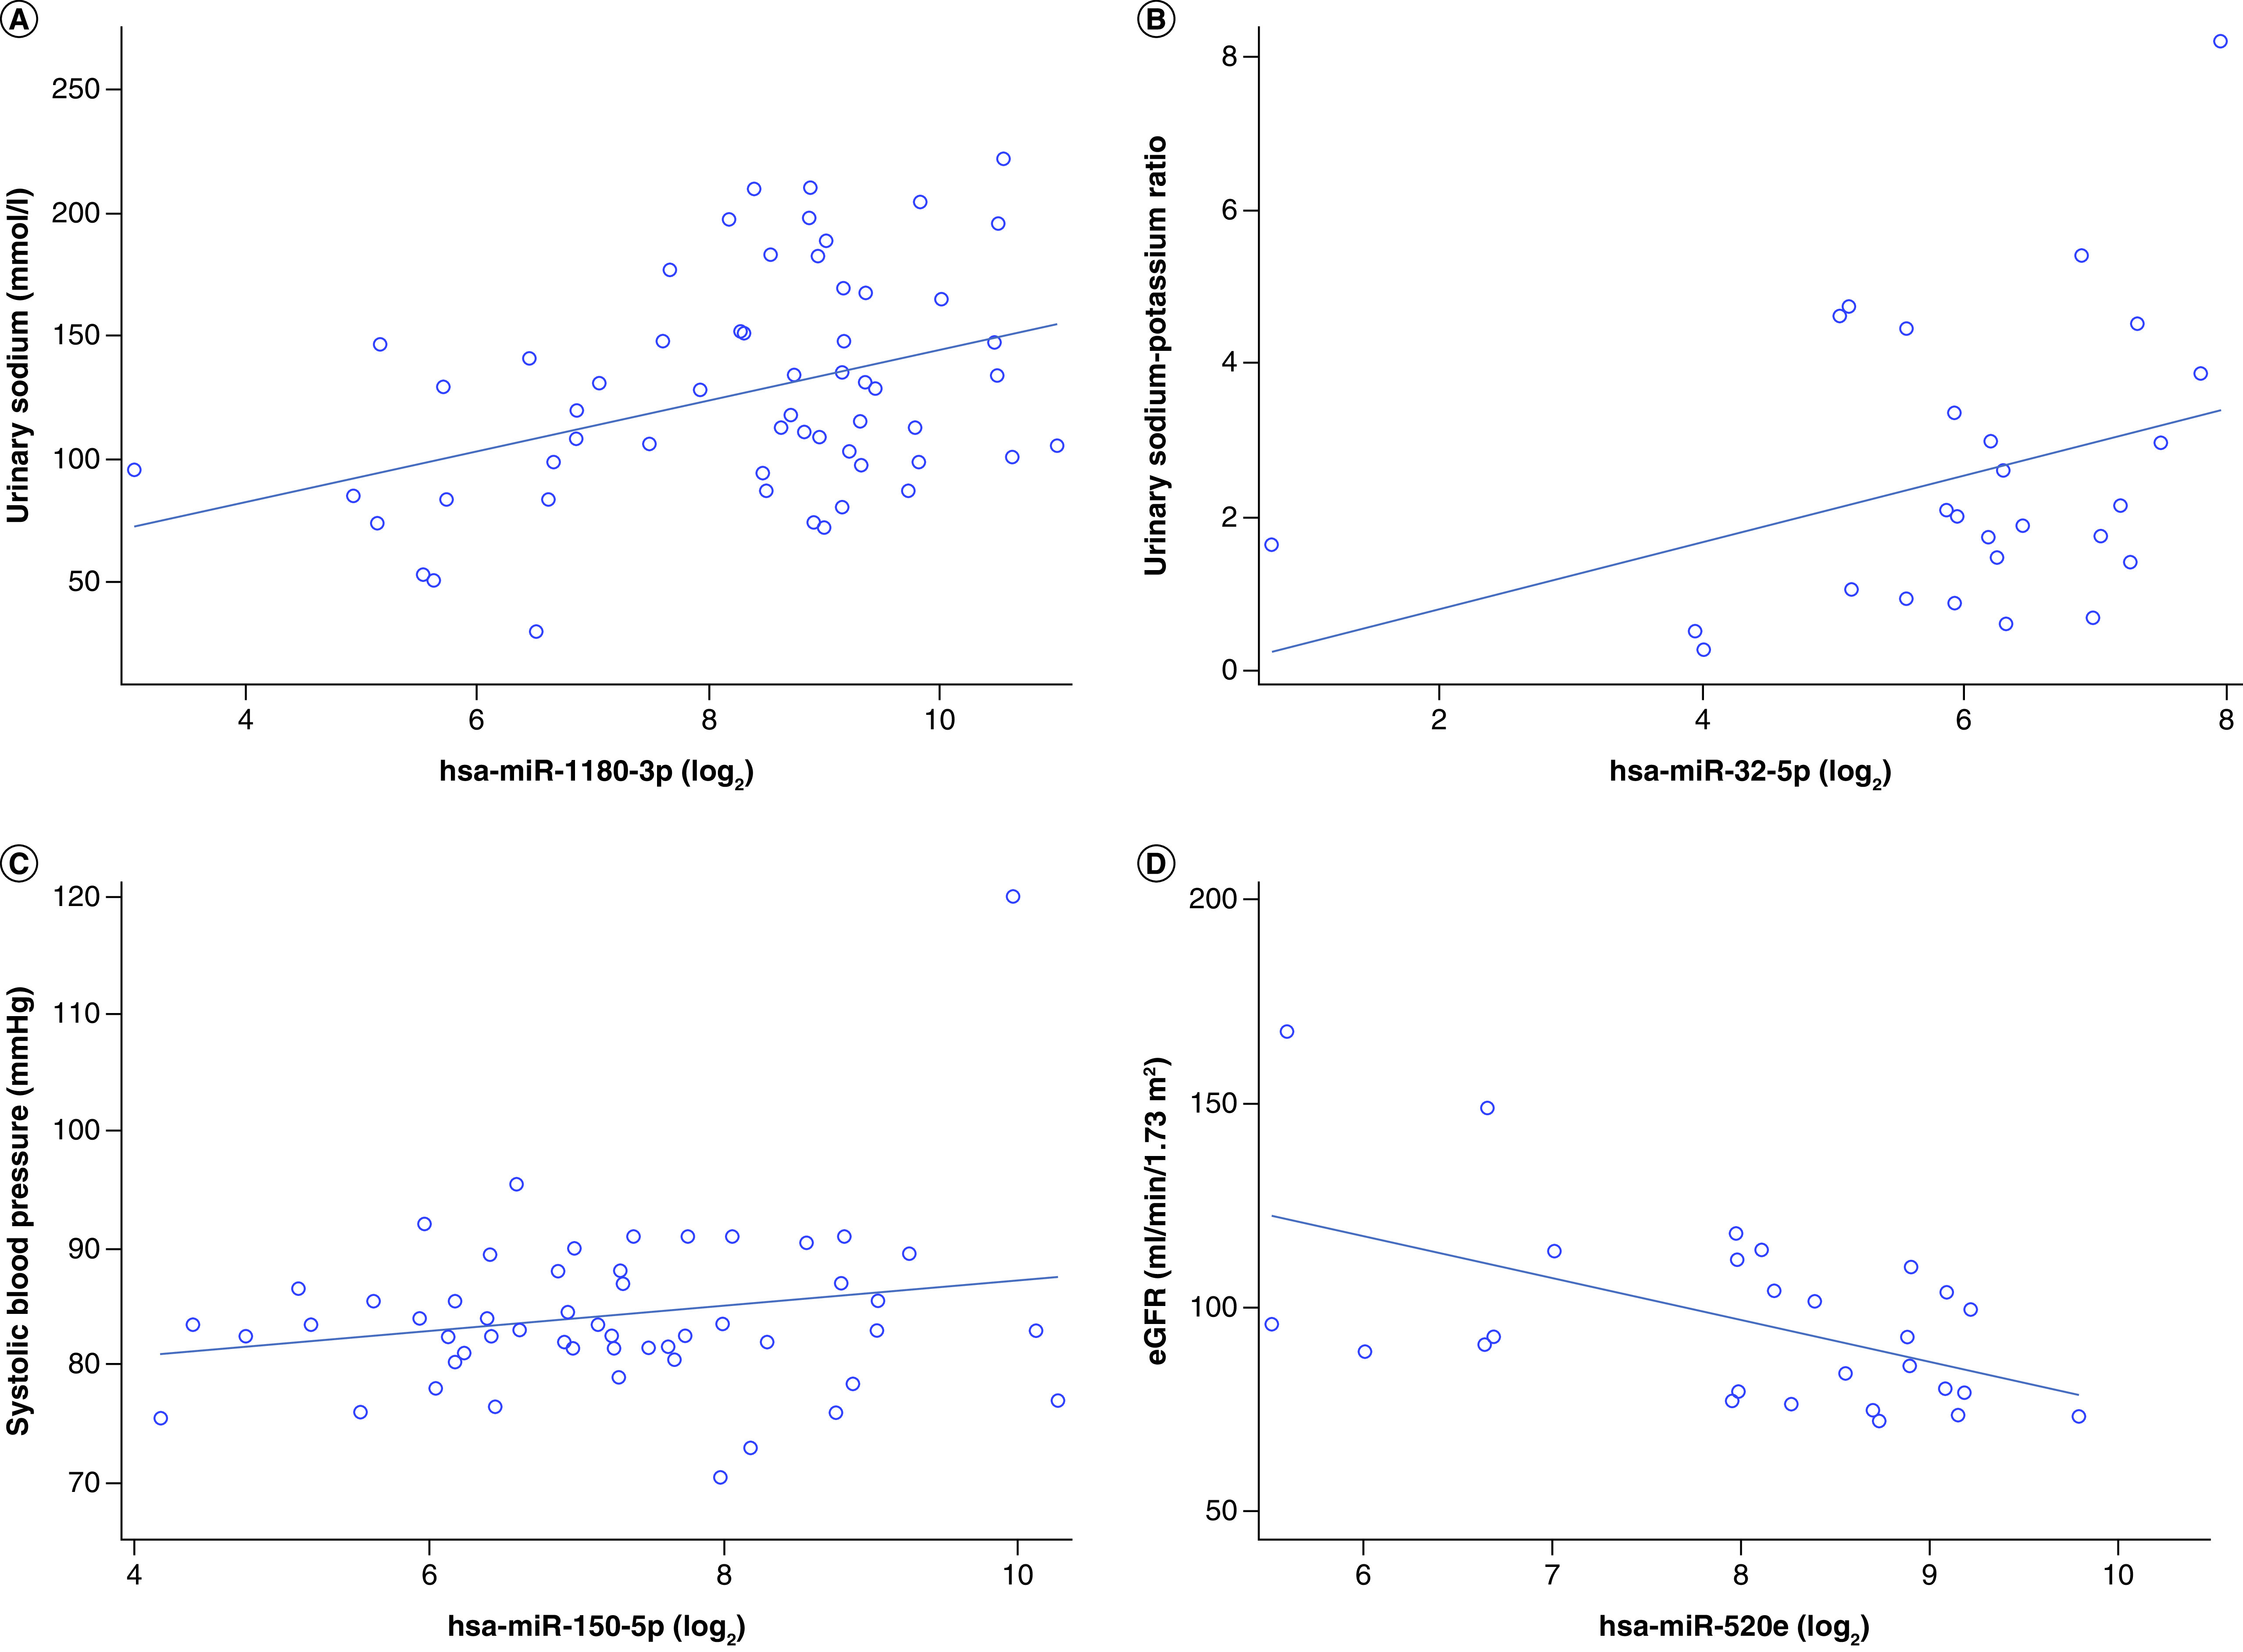
Figure 1. . Representative plots of highlighted associations between exo-miRs and cardiorenal outcomes.

Representative plots of the top (based on lowest p-value) associations between exo-miRs and cardiorenal outcomes, including (A) urinary sodium and miR-1180 (n = 59), (B) urinary sodium-to-potassium ratio and miR-32-5p (n = 27), (C) systolic blood pressure and miR-150-5p (n = 53) and (D) eGFR and miR-520e (n = 27). The plots are unadjusted regression lines.
eGFR: Estimated glomerular filtration rate; exo-miRs: Exosomal miRNAs.
