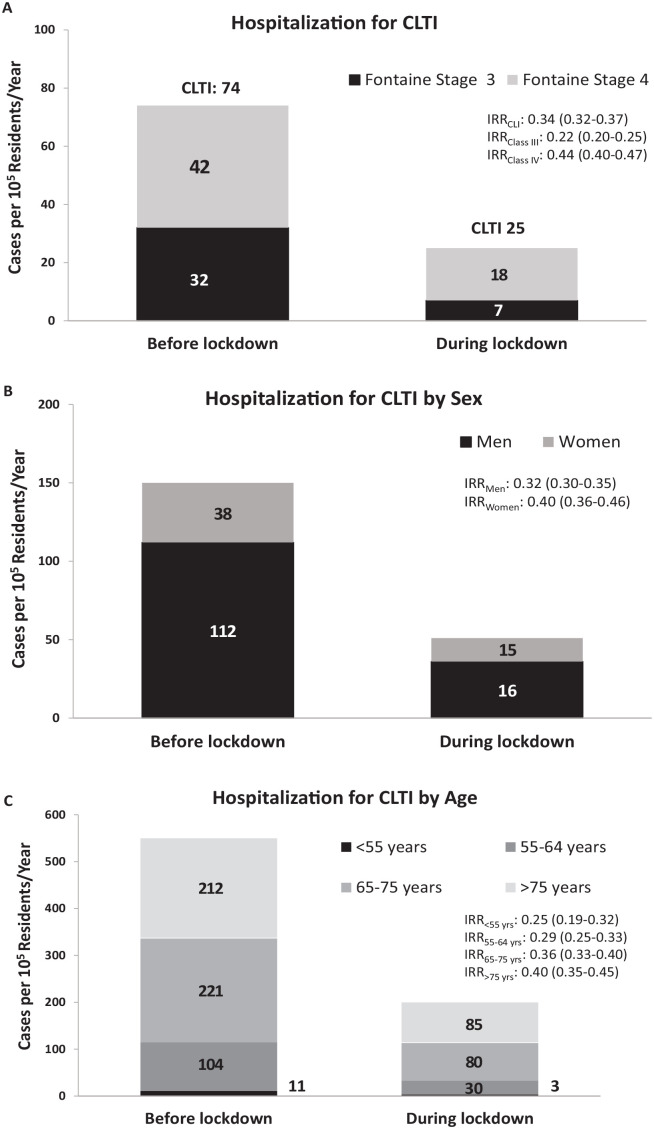
Figure 1.
Representative bar graph indicating the rate of CLTI-related hospitalization before and during the lockdown in the Campania region (March 9, 2020) (A) according to Fontaine stage 3 or 4; (B) according to sex; and (C) according to age categories.
CLTI, chronic limb-threatening ischemia; IRR, incidence rate ratio.

