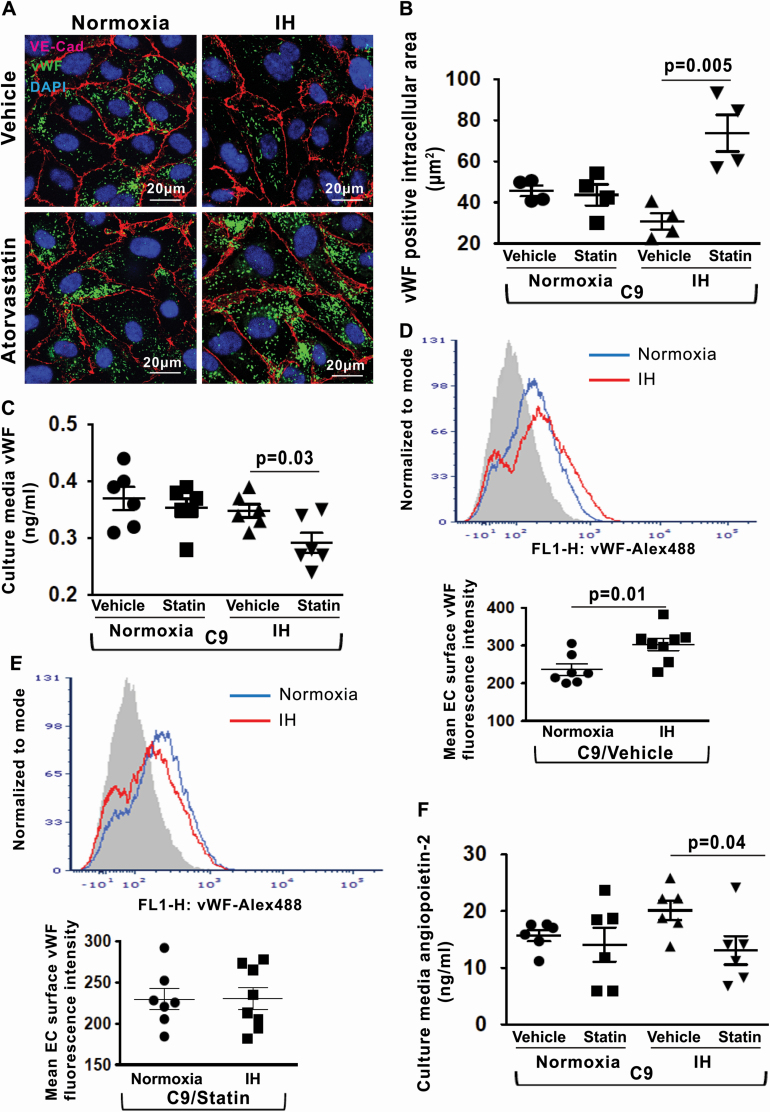
Figure 7.
Statin reduces IH-induced endothelial vWF and angiopoietin-2 release. (A) Representative confocal images of intracellular vWF protein expression in HUVECs after stimulation with recombinant C9 and treatment with atorvastatin or vehicle in normoxia and IH. EC plasma membrane is identified by immunofluorescence for VE–cadherin. Scale bars: 20 μm. (B) Quantitation of intracellular vWF protein expression (fluorescence area in μm2) in HUVECs after stimulation with C9 and treatment with atorvastatin or vehicle in normoxia and IH (n = 4). (C) Quantitation of vWF levels in HUVECs culture media in normoxia and IH after stimulation with C9 and treatment with atorvastatin or vehicle (n = 6). (D) Representative histogram with a log scale x-axis and quantification of vWF fluorescence intensity on the cell surface in HUVECs in normoxia (n = 7) and IH (n = 8) after stimulation with C9 and treatment with vehicle. (E) Representative histogram with a log scale x-axis and quantification of vWF fluorescence intensity on the cell surface in HUVECs in normoxia (n = 7) and IH (n = 8) after stimulation with C9 and treatment with atorvastatin. (F) Quantitation of angiopoietin-2 levels in HUVECs culture media in normoxia and IH after stimulation with C9 and treatment with atorvastatin or vehicle expressed in ng/mL (n = 6). All data throughout the figure are shown as the mean ± SE, two-sided t-test test. Abbreviations as in Figure 2.

