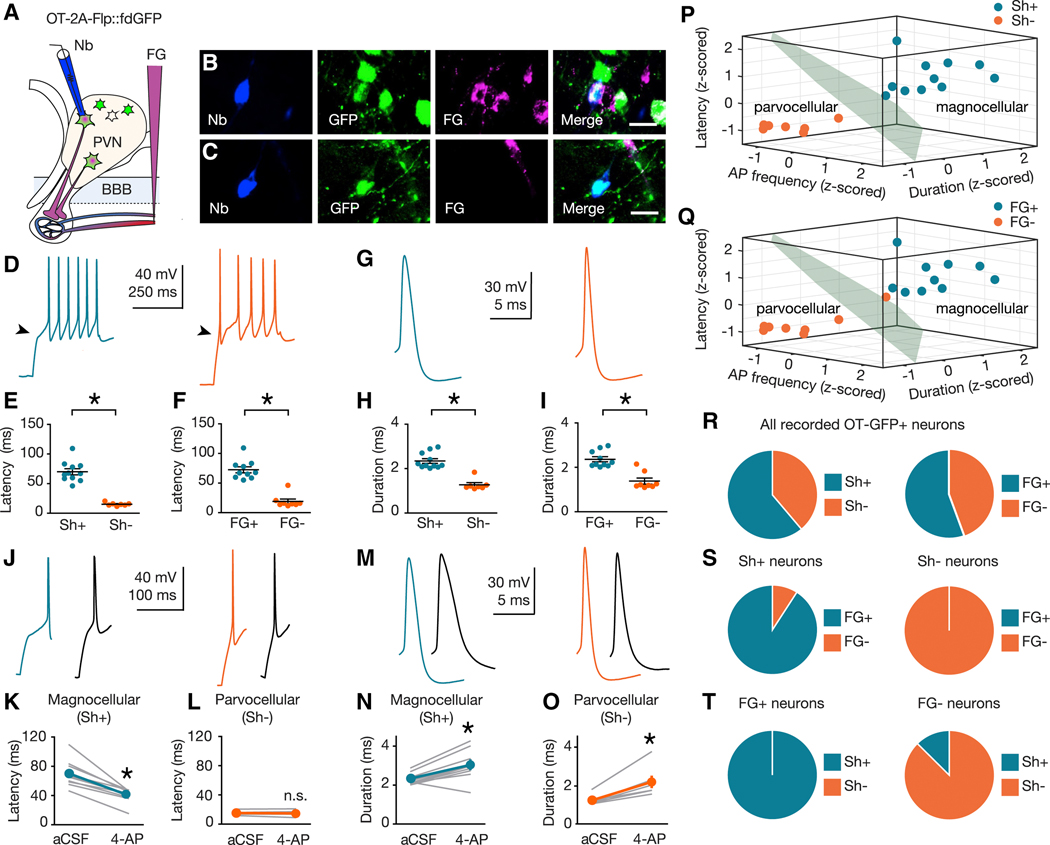
Figure. 2. Electrophysiological signatures of magnocellular and parvocellular OT neurons.
(A) Validation strategy using i.v. FG and Nb-filled recording pipette. (B,C) FG+ (B) and FG- (C) neurons recovered after electrophysiological recording. Nb (blue, left), GFP (green, center-left), FG (magenta center-right), merge (right). Scale bars 20 μm. (D,G) Representative traces from magnocellular (blue), and parvocellular (orange) OT neurons. (E,F,H,I) Latency to first AP and AP duration are shorter in Sh- (n = 7) compared to Sh+ (n = 11) OT neurons (U = 0, p > 0.001 (latency); U = 0, p > 0.001 (duration)) (E,H) and FG- (n = 8) compared to FG+ (n = 10) OT neurons (U = 0, p < 0.001 (latency); U = 5, p > 0.001 (duration)) (F,I). (J,M) Representative traces (blue, magnocellular (Sh+) OT; orange, parvocellular (Sh-) OT; black, following 5 mM 4-AP). (K,L) 4-AP reduces latency to first AP in magnocellular (Sh+, n = 10, Sum of signed ranks = 55, p = 0.002), (K) but not parvocellular (Sh-, n = 7, Sum of signed ranks = 10, p = 0.469) (L) OT neurons. (N,O) 4-AP increases AP duration in magnocellular (Sh+; n = 10, Sum of signed ranks = −51, p = 0.006) (N) and parvocellular (Sh-, n = 7, Sum of signed ranks = −28; p = 0.016) (O) OT neurons. (P,Q) K-means cluster analysis using z-scored values for AP frequency, duration, and latency to first AP for each neuron. (P) Clusters coincided completely (100%, 18 of 18 neurons) with qualitative magnocellular or parvocellular categorization based on shoulder. (Q) Cluster assignment matched magnocellular or parvocellular identity of 94% (17 of 18) neurons defined by FG labeling. (R) Left; 61% (n = 11) of sampled neurons were Sh+, and 39% (n = 7) were Sh-. Right; 56% (n = 10) sampled neurons were FG+, and 44% (n = 8) were FG-. (S) Left; 91% (n = 10 of 11) Sh+ neurons were FG+. Right; 100% (n = 7 of 7) Sh- neurons were FG-. (T) Left; 100% (n = 10 of 10) FG+ neurons were also Sh+. Right; 88% (n = 7 of 8) FG- neurons were Sh-. Data represented as mean ± sem. * indicates p < 0.05; Mann-Whitney U Test for unpaired (E,F,H,I) or Wilcoxon Rank Sum Test for paired (K,L,N,O) comparisons (both two-tailed). See also Figure S1, S2.

