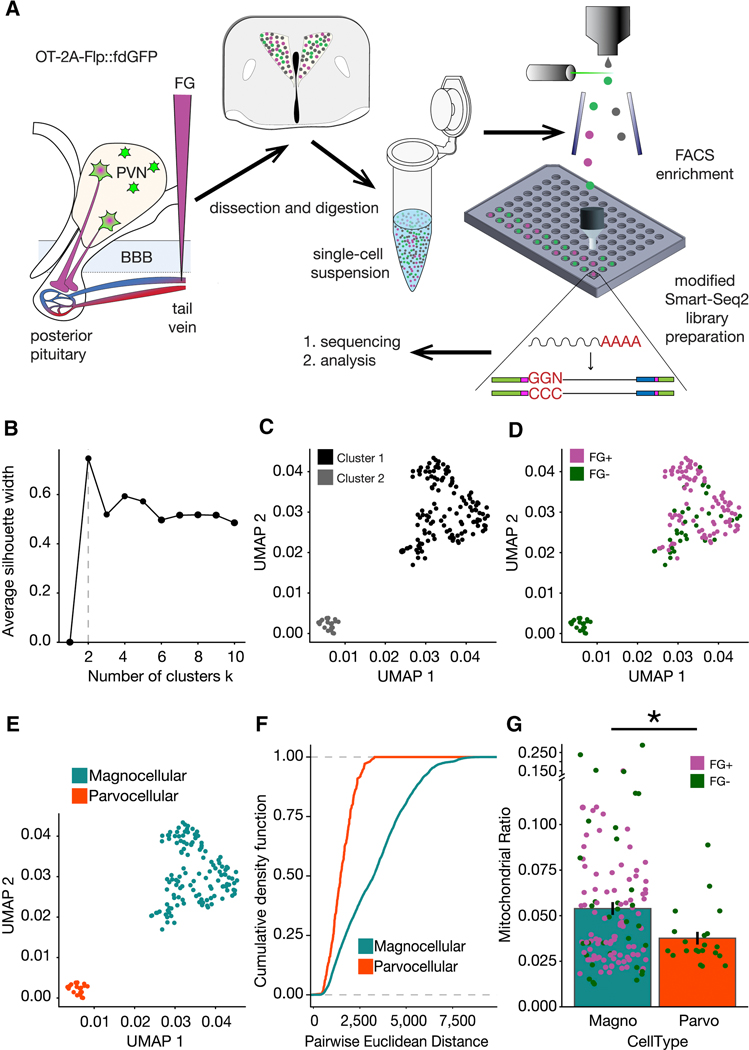
Figure 3. scRNASeq of OT expressing neurons in the PVN.
(A) Schematic overview of experiment. (B) Plot of the average silhouette width versus number of clusters for scRNAseq data indicating that the optimal number of clusters is two. (C) UMAP of scRNASeq data with the two clusters indicated by the silhouette analysis. (D) Cluster 1 is majority FG+ (91 of 125 cells; 72.8% FG+) and cluster 2 is devoid of fluorogold positive cells, (21 of 21 cells; 100% FG-).(E) Magnocellular (blue) and parvocellular (orange) neuron identity assigned to cluster 1 and cluster 2, respectively. (F) Empirical Cumulative Distribution Functions for all expressed genes in the two cell types indicated greater intra-cell type heterogeneity within magnocellular neurons (p = 1.665e−15). K-S test for statistical comparison. (G) Comparison of the density of mitochondrial RNA in the two clusters as calculated via the distributions of the per cell ratio of reads mapped to mitochondrial RNA vs total number of mapped reads. One-tailed t-test for statistical comparison (p = 0.0007972). See also Figure S1, S3.

