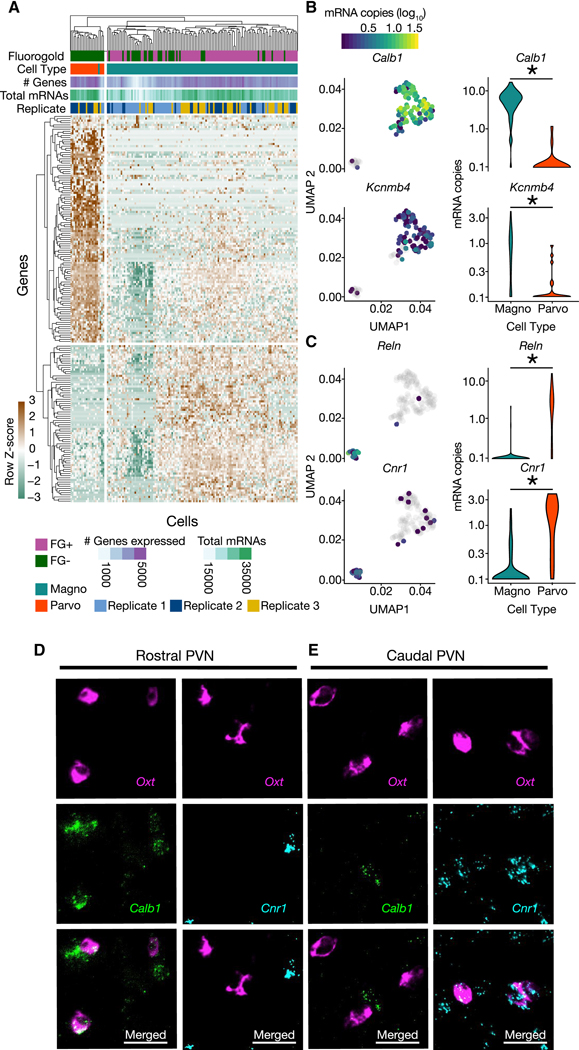
Figure 4. Differential expression analysis of clusters determines unique molecular markers of magnocellular and parvocellular OT neurons.
(A) Heatmap of significantly differentially expressed genes (Monocle Likelihood Ratio Test, FDR 0.1%) between magnocellular and parvocellular OT neurons. (B) UMAPs (left) and Violin plots (right) for genes expressed more highly in magnocellular OT neurons: Calb1 and Kcnmb4 (identified using FDR 0.00001%; p = 1.28e−30 and p = 5.46e−7, respectively). (C) UMAPs (left) and Violin plots (right) for genes expressed more highly in parvocellular OT neurons: Reln and Cnr1 (identified using FDR 0.00001%; p = 1.48e−15 and p = 6.67e−11, respectively). (D,E) Validation of differential expression via fluorescent in situ hybridization chain reaction version 3.0 (HCR 3.0) within the PVN. Calb1 but not Cnr1, is colocalized with Oxt within the rostral PVN (D). Cnr1, but not Calb1 is colocalized with Oxt in the caudal PVN (E). Scale bars 20 μm. Distribution of Calb1 (rostral) and Cnr1 (caudal) expression in OT neurons recapitulates differential localization of magnocellular (rostrally enriched) and parvocellular (caudally enriched) neurons respectively. * indicates p < 0.05; Monocle2 likelihood ratio test for statistical comparisons. See also Figure S3, and Tables S1, S2.

