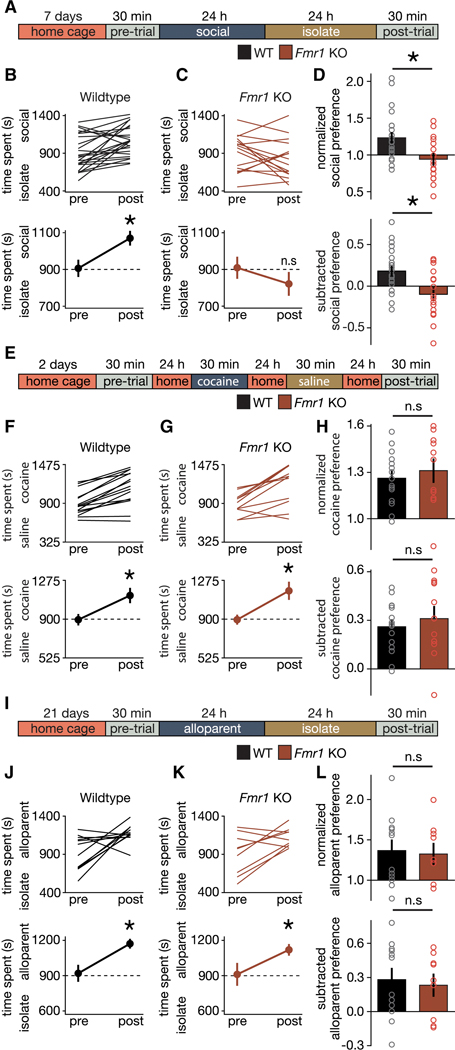
Figure 5. Fmr1 KO mice exhibit social domain-specific impairment in reward learning.
(A) Timeline for sCPP. (B,C) Individual (top) and average (bottom) data indicate that WT mice (B; t(23) = 3.586; p = 0.002) and not Fmr1 KO mice (C; t(15) = 1.324; p = 0.205) exhibit sCPP. (D) Normalized (t(38) = 2.917; p = 0.006) and subtracted (t(38) = 3.23; p = 0.003) comparisons of social preference reveal a difference in the magnitude of sCPP between WT and Fmr1 KO mice. (E) Protocol and timeline for cocaine CPP. (F,G) Individual (top) and average (bottom) data indicate that WT (F; t(14) = 6.454; p < 0.0001) and Fmr1 KO mice (G; t(10) = 4.297; p = 0.002) exhibit cocaine CPP. (H) Normalized (t(24) = 0.609; p = 0.548) and subtracted (t(24) = 0.644; p = 0.525) comparisons of cocaine preference reveal a similar magnitude of cocaine CPP in WT and Fmr1 KO mice. (I) Protocol and timeline for alloparent CPP. (J,K) Individual (top) and average (bottom) data indicate that WT (J; t(11) = 2.931; p = 0.014) and Fmr1 KO mice (K; t(8) = 2.488; p = 0.038) exhibit alloparent CPP. (L) Normalized (t(19) = 0.234; p = 0.817) and subtracted (t(19) = 0.354; p = 0.727) comparisons of alloparent preference reveal a similar magnitude of alloparent CPP in WT and Fmr1 KO mice. Data represented as mean ± sem. * indicates p < 0.05; Student’s t-test (two-tailed; paired (B,C,F,G,J,K) or unpaired (D,H,L)) for statistical comparisons.

