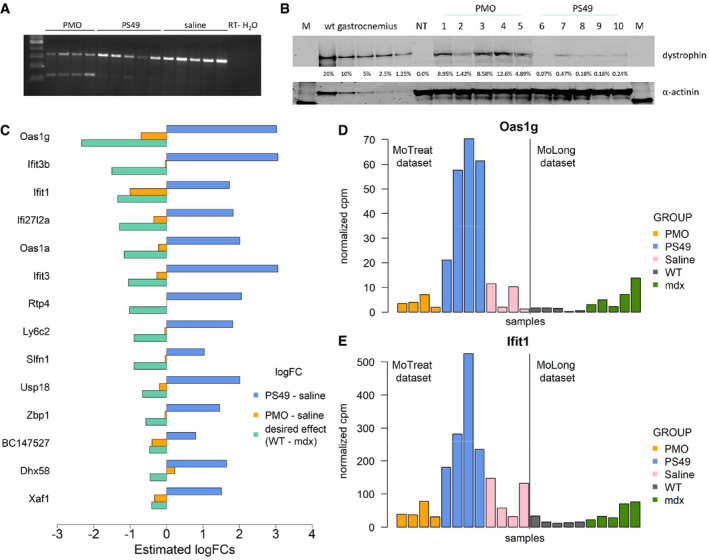
Figure 5. Analysis of the effect of dystrophin restoration by antisense oligonucleotides on gene expression in blood (MoTreat dataset).

-
ART–PCR (30 cycles) showing skipping of exon 23 for PMO and PS49 oligos. No skipping was visible in saline‐treated mice.
-
BWestern blot showing the percentage of restoration of dystrophin protein in mdx mice following antisense oligonucleotides administration. M is molecular ladder. WT gastrocnemius represents the standard curve using protein extracts from gastrocnemius muscle. NT is saline‐treated mdx mice.
-
CBarplot comparing the estimated logFC for the PS49 and PMO treatments in the MoTreat dataset to the desired drug effect obtained from the MoLong dataset (logFC WT vs. mdx at week 12).
-
D, EHistograms comparing the distribution of selected genes across different mice groups (PMO, PS49, and saline in the MoTreat dataset, WT and mdx at week 12 in the MoLong dataset).
