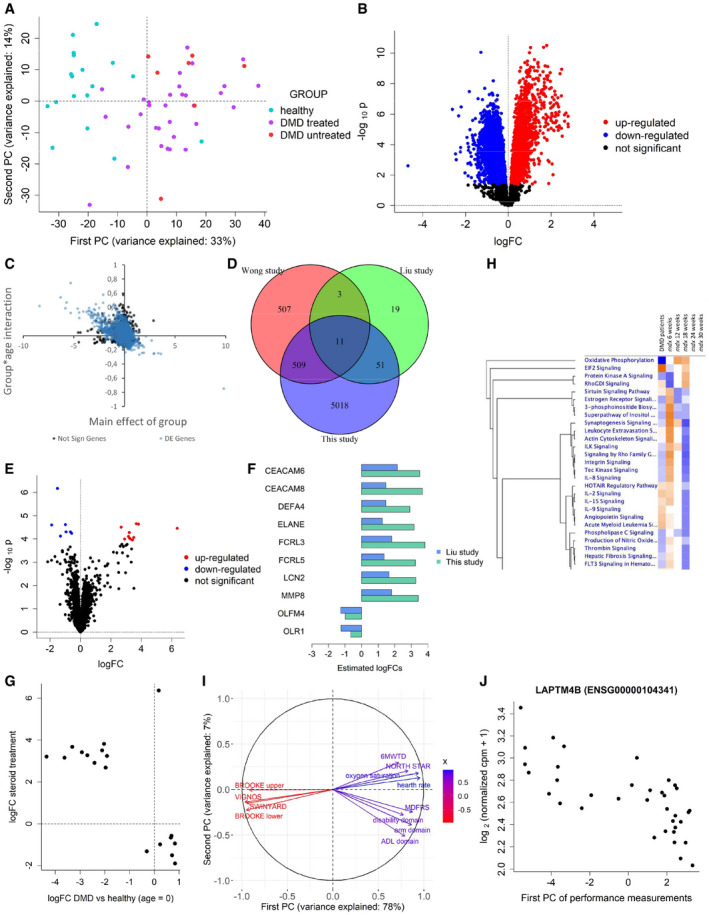
Figure 6. Results of the analysis of the DMDMex dataset.

- Principal component analysis of the DMDMex RNA‐seq counts.
- Volcano plot for the F test on differential expression between healthy individuals and DMD patients.
- Scatter plot showing the group effect at baseline (x‐axis) and the effect of the interaction between age and group (y‐axis). Black dots represent non‐differentially expressed genes, while blue dots represent differentially expressed genes.
- Volcano plot for the F test on differential expression between treated and untreated DMD patients.
- Barplot comparing the logFC of the genes associated with steroid treatment estimated in this study to the estimates of Liu et al (2015).
- Scatter plot showing genes for which a significant effect of treatment with steroids. The group effects at baseline are plotted on the x‐axis, while the effects of steroids are plotted on the y‐axis.
- Heatmap obtained by Ingenuity Pathway Analysis comparing the pathways affected in DMD patients to the pathways affected at different time points in mouse.
- Correlation circle representing the correlation between physical tests and their first two principal components.
- Scatter plot showing the relationship between the first principal component of body measurements and the expression levels of LAPTM4B.
