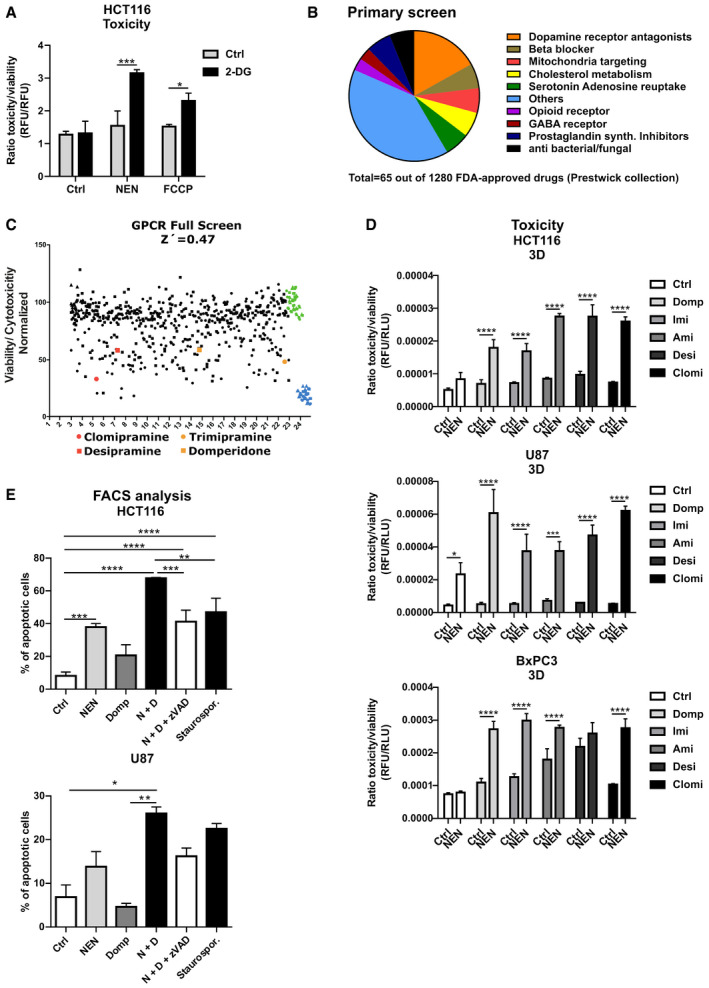
Figure 1. Mitochondrial uncoupling induces targetable metabolic vulnerabilities.

- HCT116 cells were treated as indicated (Control (Ctrl), 2‐DG 100 mM; NEN 1.2 µM; FCCP 2.5 µM). Graph shows the ratio of toxicity and viability measured after a 24‐h treatment.
- Pie chart depicting numerical proportions of indicated drug categories on total hits from the phenotypic screening using the FDA‐approved drug library.
- Plot shows results of GPCR screen as ratio of cell toxicity and viability. Domperidone and TCAs highlighted in red and orange, vehicle controls in green, and positive toxicity controls in blue. Z′ factor was calculated according to the formula Z′ = 1 – (3(θp + θn)/(μp – μn)), where p is the positive control, n is the negative control, θ is the standard deviation, and μ is the mean. For hit selection, a threshold of lower than 3 standard deviations from the median of the negative/vehicle population was set.
- Ratio of toxicity and viability of HCT116, U87 and BxPC3 cells grown in spheroids (3D) and treated as indicated for 24 h (BxPC3) or 48 h (HCT116, U87) (NEN 1.2 µM; domperidone (Domp), imipramine (Imi), desipramine (Desi), and amitriptyline (Ami), each 30 µM; clomipramine (Clomi) 20 µM).
- Percentage of apoptotic cells, determined by measuring Annexin V‐ and PI‐positive HCT116 or U87 cells by FACS. The effects were assessed after a 24‐h or 48‐h treatment, respectively (NEN (N) 1.2 µM; domperidone (Domp, D) 30 µM, zVAD‐FMK (zVAD) 100 µM, Staurosporine 100 µM). Cells were pre‐treated for 1 h with the zVAD‐FMK inhibitor prior to adding the drugs.
Data information: Data in (A, D and E) are presented as mean (SD) (N = 3) and were analyzed by two‐way ANOVA with Tukey post hoc test (A, D) or one‐way ANOVA with Tukey post hoc test (for (E, upper graph) HCT116 cells) or by Kruskal–Wallis with Dunn’s post hoc tests (for (E, lower graph) U87 cells). Significance is indicated for multiple comparisons as indicated. *P < 0.05; **P < 0.01; ***P < 0.001; ****P < 0.0001. Exact P‐values for all comparisons are listed in Appendix Table S1.
