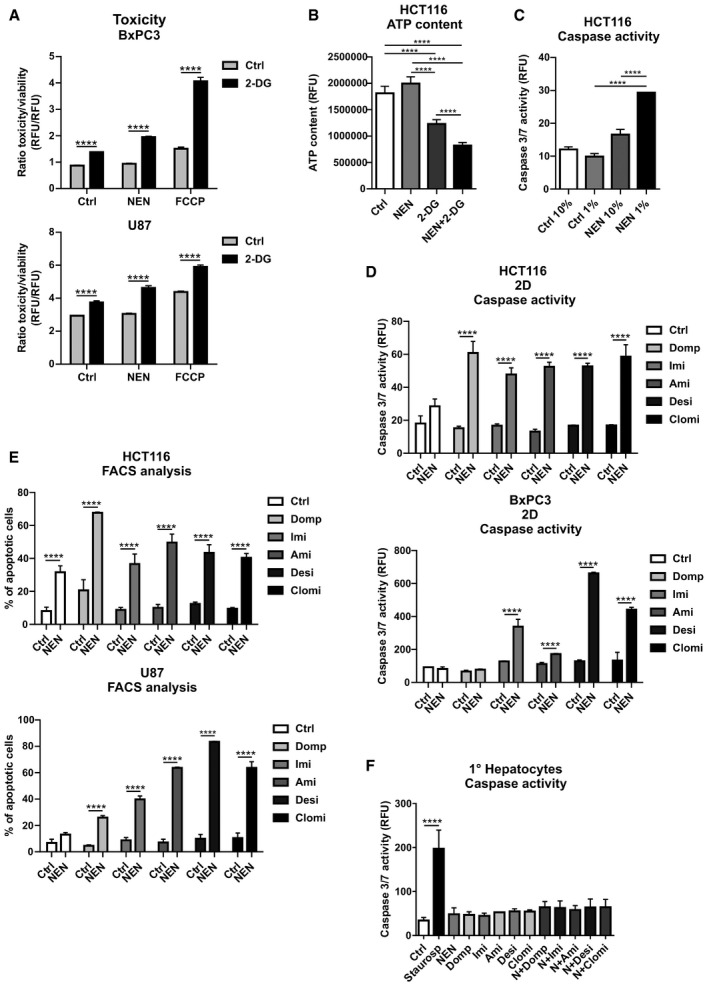
Figure EV1. Mitochondrial uncoupling induces secondary vulnerabilities.

- BxPC3 and U87 cells grown in monolayer were treated as indicated (Control (Ctrl), 2‐DG 100 mM; NEN 1.2 µM; FCCP 2.5 µM). Graph shows the ratio of toxicity and viability measured after an 18 h treatment.
- HCT116 cells were treated as indicated (NEN 1.2 µM; 2‐DG 100 mM) for 8 h and ATP content was measured.
- Caspase activity of HCT116 cells grown in 10 or 1% serum supplemented medium and treated as indicated for 18 h treatment (NEN 1. 2 µM).
- Caspase activity in HCT116 and BxPC3 cells grown as monolayer (2D) treated as indicated for 18 or 48 h, respectively (NEN 1.2 µM; domperidone (Domp), imipramine (Imi), desipramine (Desi), and amitriptyline (Ami), each 30 µM; clomipramine (Clomi) 20 µM).
- Percentage of apoptotic cells, determined by measuring Annexin V‐ and PI‐positive HCT116 or U87 cells by FACS. The effects were assessed after a 24‐h or 48‐h treatment, respectively (NEN 1.2 µM; domperidone (Domp), imipramine (Imi), desipramine (Desi), and amitriptyline (Ami), each 30 µM; clomipramine (Clomi) 20 µM).
- Caspase activity of primary hepatocytes treated as indicated for 24 h (NEN (N) 1.2 µM; domperidone (Domp), imipramine (Imi), desipramine (Desi), and amitriptyline (Ami), each 30 µM; clomipramine (Clomi) 20 µM). Staurosporine (100 µM) was used as positive control.
Data information: In (A (N = 3), B (N = 5), C (N = 3), D (N = 3), E (N = 3), F (for Ctrl, NEN, Domp, NEN + Domp (N = 6); for Imi, Ami, Desi, Clomi, N + Imi, N + Ami, N + Desi, N + Clomi (N = 3); for Saurospo (N = 12)), data are presented as mean (SD) and were analyzed by a one‐way (B, C) or two‐way (A, D) ANOVA with Tukey post hoc test, Kruskal–Wallis with Dunn’s post hoc tests (E) or a one‐way ANOVA + Welch’s correction with Dunnett’s post hoc test (F, statistical differences relative to Ctrl). ****P < 0.0001. Exact P‐values for all comparisons are listed in Appendix Table S1.
