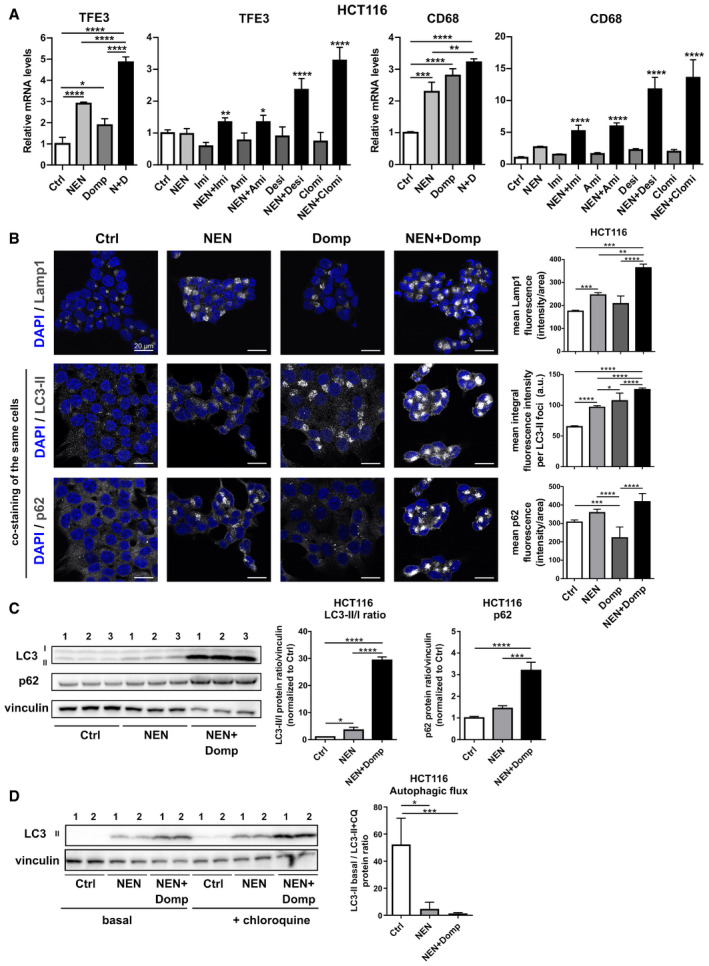
Figure 3. Combinatorial treatments induces CLEAR network associated with a blockage in autophagy.

- Relative mRNA expression levels of indicated CLEAR network genes in HCT116 cells treated as indicated ((NEN (N) 1.2 µM; domperidone (Domp, D), imipramine (Imi), desipramine (Desi), and amitriptyline (Ami), each 30 µM; clomipramine (Clomi) 20 µM), determined by qPCR.
- Immunofluorescence (IF) of HCT116 cells treated with DMSO (Control (Ctrl)), NEN, domperidone (Domp) or NEN + Domp as indicated (NEN, 1.2 µM; Domp, 30 µM) for 16 h and stained with anti‐Lamp1 (top panel), Alexa‐555 LC3 (middle panel) co‐stained with Alexa‐647 p62 (bottom panel). Nuclei, Blue (dapi). Scale bar 20 µm. Mean (SEM) fluorescence of Lamp1 (Ctrl, NEN, Domp (N = 20 cells); NEN + Domp (N = 24 cells)), LC3‐II (Ctrl, NEN + Domp (N = 16 cells)); NEN, Domp (N = 16 cells)) or P62 (Ctrl (N = 38 cells); NEN (N = 27 cells); Domp (N = 28 cells); NEN + Domp (N = 21 cells)) was quantified and analyzed by one‐way ANOVA with Tukey post hoc test (for LC3‐II) or Kruskal–Wallis with Dunn’s post hoc test (for Lamp1 and p62). *P < 0.05; **P < 0.01; ***P < 0.001; ****P < 0.0001.
- Immunoblot analysis and quantification (mean ± SD) of LC3‐II/LC3‐I ratios and P62 in HCT116 cells. Cultured cells were treated with DMSO (Control), NEN or NEN and domperidone (Domp) as indicated (NEN, 1.2 µM; Domp, 30 µM) for 16 h. Protein band signal intensities were normalized to vinculin (loading control), and the ratios LC3‐II bands LC3‐I (N = 3) and p62 levels (N = 3) were analyzed by one‐way ANOVA with Tukey post hoc test. *P < 0.05; ***P < 0.001; ****P < 0.0001.
- Immunoblot analysis and quantification of LC3 in HCT116 cells (mean ± SEM). Cultured cells were treated with DMSO (Control (Ctrl)), NEN or NEN and domperidone (NEN + Domp) as indicated (NEN, 1.2 µM; Domp, 30 µM) for 16 h, followed by control or 20 µM chloroquine treatment for 3 h. Protein band signal intensities were normalized to vinculin (loading control), and the ratios LC3‐II bands in presence or absence of chloroquine treatment (N = 6) were analyzed by Kruskal–Wallis with Dunn’s post hoc test. *P < 0.05; ***P < 0.001.
Data information: In (A) (first (TFE3) and third (CD68) graph (N = 3); second (TFE3) and fourth (CD68) graph (N = 5, besides NEN + Clomi (N = 4) and NEN + Desi (N = 4)), data are presented as mean (SD) and were analyzed by a one‐way ANOVA with Tukey post hoc test. In the second and the fourth graph, significance is indicated for the comparison of combinatorial treatments (NEN + TCAs) to controls (Ctrl). *P < 0.05; **P < 0.01; ***P < 0.001; ****P < 0.0001. Exact P‐values for all comparisons are listed in Appendix Table S1.
