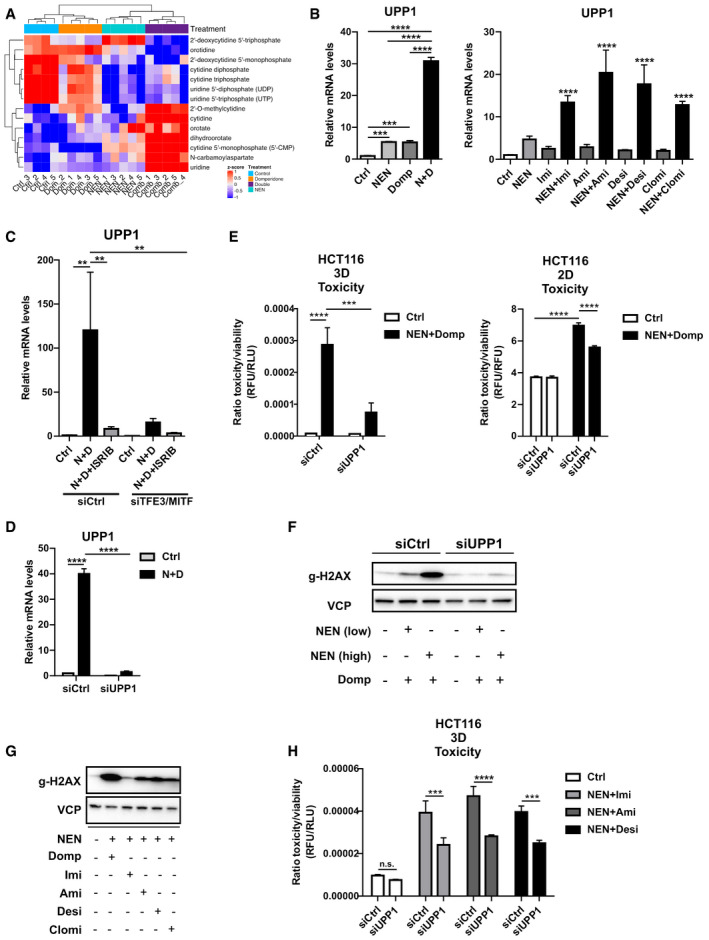
Figure 4. UPP1 induction deregulates pyrimidine metabolism and contributes to cell death.

- Heat map for pyrimidine pathway‐related metabolites derived from a non‐targeted metabolomics analysis, depicting relative levels in HCT116 cells treated as indicated for 18 h (NEN (N) 1.2 µM, domperidone (Dom) 30 µM, or in combination (Comb).
- Relative UPP1 mRNA expression levels in HCT116 cells treated as indicated (NEN (N) 1.2 µM, domperidone (Domp, D) 30 µM, imipramine (Imi), desipramine (Desi), amitriptyline (Ami) each 30 µM, clomipramine (Clomi) 20 µM), determined by qPCR.
- Relative UPP1 mRNA expression levels in HCT116 cells either transfected with control (siCtrl) or combined TFE3‐ and MITF‐targeting (siTFE3/siMITF) siRNAs and treated as indicated (NEN (N) 1.2 µM, domperidone (D) 30 µM, ISRIB 1 µM), determined by qPCR.
- Relative UPP1 mRNA expression in HCT116 cells transfected either with control (siCtrl) or UPP1‐targeting (siUPP1) siRNAs and treated as indicated (NEN (N) 1.2 µM, domperidone (D) 30 µM).
- Ratio of toxicity and viability measurements of HCT116 spheroids (3D) and 2D cultures, treated as indicated (NEN 1.2 µM, domperidone 30 µM). Cells were transfected either with control (siCtrl) or UPP1‐targeting (siUPP1) siRNAs prior to spheroid formation or during cell seeding.
- Immunoblot of HCT116 whole cell lysate using antibodies against the indicated proteins upon treatment of the cells as indicated for 16 h (NEN (low) 0.6 µM or NEN (high) 1.2 µM, domperidone (Domp) 30 µM). Cells were transfected either with control (siCtrl) or UPP1‐targeting (siUPP1) siRNAs 48 h prior to treatment.
- Immunoblot of HCT116 whole cell lysates using antibodies against the indicated proteins upon treatment of the cells as indicated for 16 h (NEN 1.2 µM, domperidone (Domp), imipramine (Imi), amitriptyline (Ami) and desipramine (Desi), each 30 µM, clomipramine (Clomi) 20 µM).
- Ratio of toxicity and viability of HCT116 spheroids (3D) treated as indicated (NEN 1.2 µM, imipramine (Imi), desipramine (Desi), amitriptyline (Ami), each 30 µM). Cells were transfected with control (siCtrl) or UPP1‐targeting (siUPP1) siRNAs 24 h prior to spheroid formation.
Data information: In (B, C, D, E and H), data (N = 3) are presented as mean (SD) and were analyzed by one‐way ANOVA with Tukey post hoc test (B) or two‐way ANOVA with Tukey post hoc test (C, D, E, H). In (B), right panel, significance is indicated for the comparison of combinatorial treatments (NEN + TCAs) to controls. **P < 0.01; ***P < 0.001; ****P < 0.0001. Exact P‐values for all comparisons are listed in Appendix Table S1.
