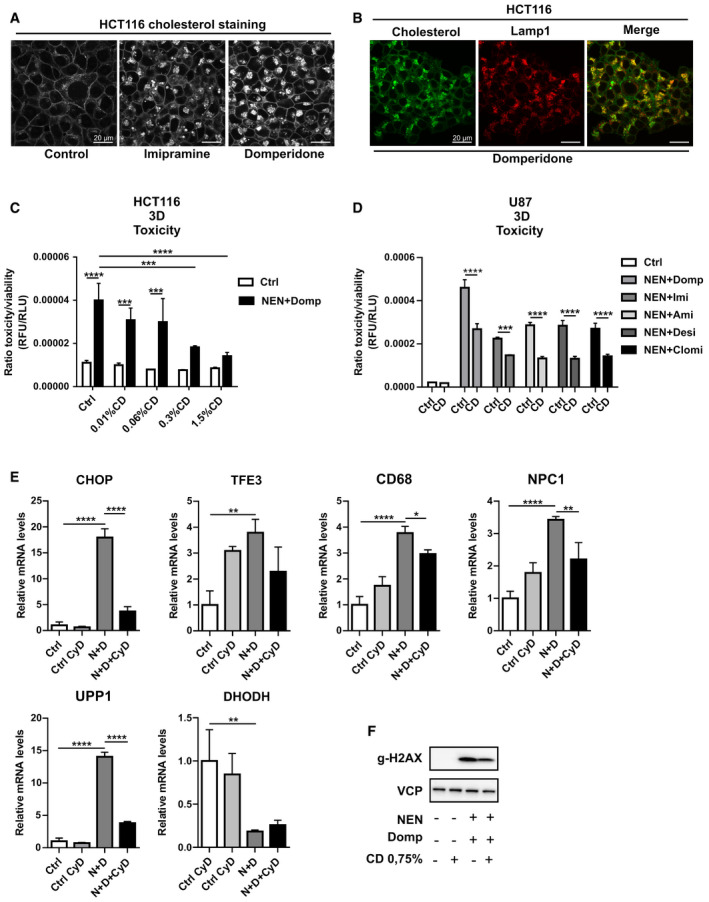
Figure 6. Cholesterol dysregulation contributes to stress pathway induction and cell death.

- Immunofluorescence (IF) images of HCT116 cells treated as indicated for 12 h (imipramine and domperidone, each 30 µM) and stained for cholesterol content using filipin III.
- Immunofluorescence (IF) images of HCT116 cells treated with domperidone and co‐stained for cholesterol and Lamp1.
- Ratio of toxicity and viability of HCT116 spheroids (3D) treated as indicated (NEN 1.2 µM, domperidone (Domp) 30 µM). Cyclodextrin content in the medium is indicated in percentage (%CD).
- Ratio of toxicity and viability of U87 spheroids (3D) treated as indicated (NEN 1.2 µM, domperidone (Domp), imipramine (Imi), amitriptyline (Ami), desipramine (Desi), each 30 µM, clomipramine (Clomi 20 µM, Cyclodextrin (CD) 0.75%).
- Relative mRNA expression levels of the specified genes in HCT116 cells, treated as indicated for 16 h (NEN (N) 1.2 µM, domperidone (D) 30 µM, Cyclodextrin (CyD) 0.75%).
- Immunoblot analysis of HCT116 whole cell lysates using antibodies against gammaH2AX and treated as indicated for 16 h (NEN 1.2 µM, domperidone (Domp) 30 µM, Cyclodextrin (CD) 0.75%).
Data information: In (C, D and E), data are presented as mean (SD) (N = 3) and were analyzed by a one‐way ANOVA with Tukey post hoc test or a two‐way ANOVA with Tukey post hoc test (C and D). *P < 0.05; **P < 0.01; ***P < 0.001; ****P < 0.0001. Exact P‐values for all comparisons are listed in Appendix Table S1.
