
Figure EV5. Subretinal injection of AAV2.GL and AAV2.NN in mouse.
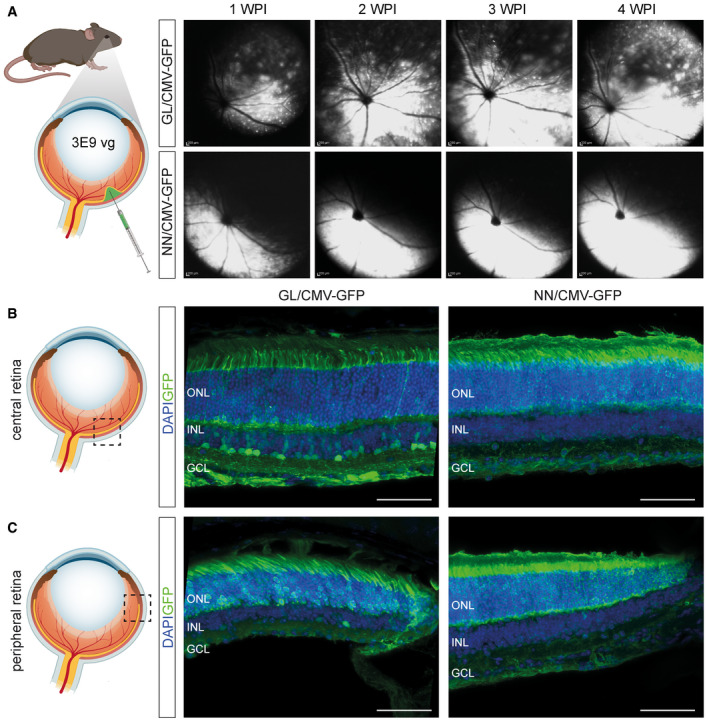
Vector mediated eGFP expression and lateral spreading after subretinal injection in 1‐month‐old mouse retinas.
- Schematic depiction of subretinal injection in wild‐type mice followed by weekly in vivo cSLO examinations of the mouse retina from 1 to 4 weeks post‐injection (WPI) of 3E9 total vg (in 1 µl) of sc‐CMV‐eGFP packaged with AAV2.GL and AAV2.NN capsid variants.
- Schematic depiction of central locus shown in adjacent confocal scans of retinal cross sections immunolabelled for eGFP and DAPI, reporting transduction efficacy of AAV2.GL (left) and AAV2.NN (right).
- Schematic depiction of peripheral locus shown in adjacent immunolabelled confocal scans, as in (B).
Data information: Acquisition settings were kept constant for all samples. GFP = eGFP; ONL, outer nuclear layer; INL, inner nuclear layer; GCL, ganglion cell layer. Scale bar: 50 μm.
Source data are available online for this figure.