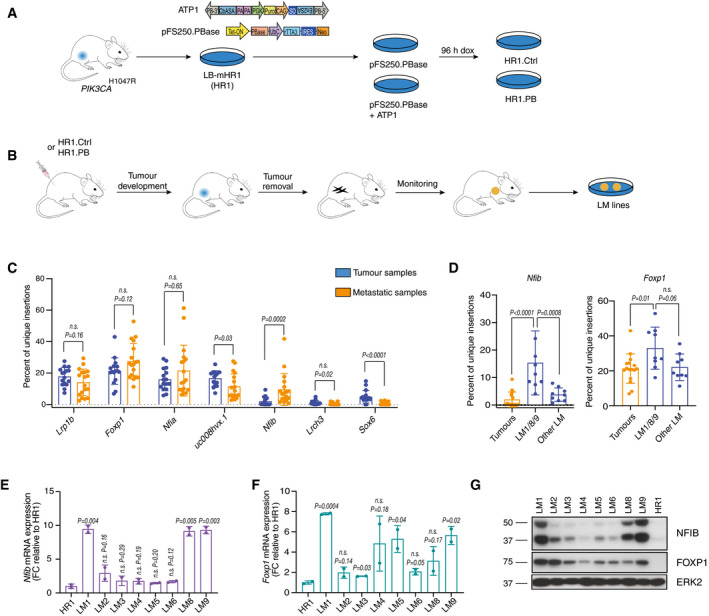
Figure 1. Transposon mutagenesis screen identifies Nfib as a candidate metastatic inducer in breast cancer.

- Screen design: generation of mammary cancer cell lines LB‐mHR1 (HR1) from PIK3CA H1047R mutant transgenic animals and transfection with the piggyBac (PB) system (HR1 Ctrl and HR1. PB cells) (Ivics et al, 2009). PB transposon (ATP1‐Puro) and transposase (pFS250. PBase) plasmid design. PB‐3’/5’, piggyBac inverted terminal repeats; CβASA, Carp β‐actin splice acceptor; En2SA, Engrailed‐2 exon‐2 splice acceptor; SD, Foxf2 exon‐1 splice donor; pA, bidirectional SV40 polyadenylation signal; PGK, mouse phosphoglycerate kinase 1 promoter; Puro, puromycin resistance; CAG, cytomegalovirus enhancer and chicken beta‐actin promoter; Tet‐ON, tetracycline‐responsive element‐tight promoter; PBase, PB transposase; UbC, Ubiquitin C promoter; rTTA3, reverse tetracycline transactivator 3; IRES, internal ribosomal entry site; Neo, Neomycin/G418 selection marker. The cell pools were treated with doxycycline (1 μg/ml) for 96 h in vitro.
- In vivo screen design: generation of lung metastatic mammary cancer cell lines (LM) from HR1. PB cell lines after orthotopic injections of HR1. PB or HR1. Ctrl.
- Bar graph showing the percentage of unique insertions in the top 7 genes normalized to the total number of insertions in a given sample. Genes are annotated with a gene symbol when available otherwise with UCSC ID transcript names. Data are from all the sequenced samples (tumour samples: 16 primary tumours; metastatic samples: 3 lung micro‐metastases, 6 lung macro‐metastases and 9 LM cell lines). Means ± s.d., two‐tailed Mann–Whitney U‐test, n.s. = not significant.
- Bar graphs showing the percentage of unique insertions in Nfib and Foxp1 in tumours, LM1, LM8, LM9 and other LM cell lines normalized to the total number of insertions in a given sample. Dots represent individual samples (Tumours n = 16, LM1/8/9 n = 9, Other LM n = 9), means ± s.d., two‐tailed Mann–Whitney U‐test, n.s. = not significant.
- Bar graph representing mean Nfib mRNA expression normalized to HR1 cells. n = 2 biological replicates and n = 2 technical replicates, means ± s.d., two‐tailed Student’s t‐test, FC = fold change.
- Bar graph representing mean Foxp1 mRNA expression normalized to HR1 cells. n = 2 biological replicates and n = 2 technical replicates, means ± s.d., two‐tailed Student’s t‐test, FC = fold change.
- Immunoblot analysis of LM and HR1 cell lines showing NFIB and FOXP1 protein levels. ERK2 served as a loading control.
Source data are available online for this figure.
