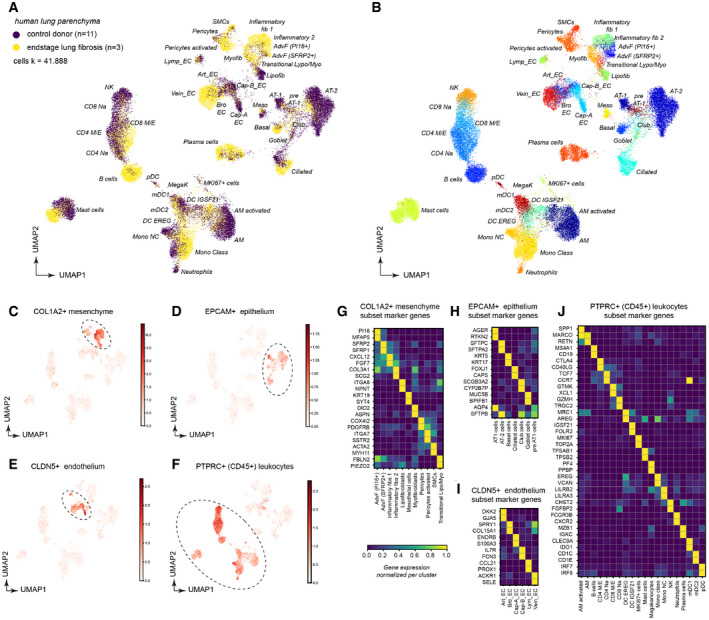
Figure 1. Single‐cell analysis of human lung parenchyma reveals 45 distinct cell type identities and their marker genes in ILD.

-
A, BDimension‐reduced single‐cell transcriptomic data are visualized through Uniform Manifold Approximation and Projection (UMAP). The color code illustrates the disease status (A) and cell type identity (B) (see Dataset EV3 for abbreviations).
-
C–FThe indicated marker genes were used to select clusters for subsetting into stromal cells (C), epithelial cells (D), endothelial cells (E), and leukocytes (F).
-
G–JThe heatmaps show the relative gene expression levels for the indicated marker genes for the indicated stromal (G), epithelial (H), endothelial (I), and leukocyte (J) cell types.
