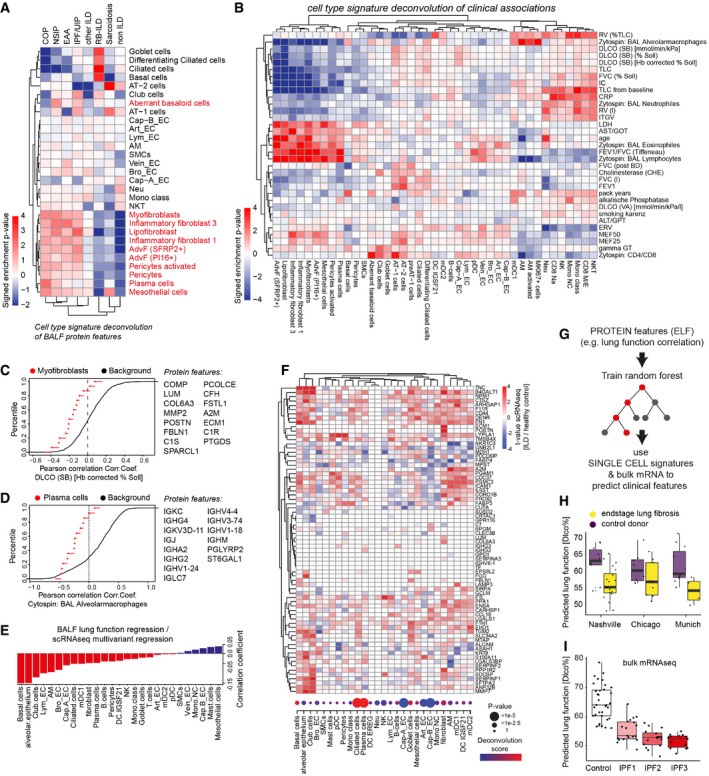
Figure 5. Protein signatures in BALF predict lung function decline and the corresponding cellular changes.

-
A, BThe heatmaps show the deconvolution scores of cell types across BALF samples grouped by diagnosis (A) and indicated clinical parameters (B).
-
C, DEmpirical cumulative density plots depict the distribution of correlation coefficients for (C) Myofibroblast markers (red points) with DLCO and (D) Plasma cell markers (red points) with % alveolar macrophages in BAL in comparison to all background proteins (black line).
-
EBarplot displays coefficients derived from correlating lung function associations at the protein level with cell type‐specific ILD associations at the RNA level.
-
FThe heatmap illustrates gene expression changes associated with lung fibrosis across indicated cell types (columns) for selected BALF protein biomarkers (rows). The dotplot visualizes the frequency changes of the indicated cell types inferred from the deconvolution of bulk mRNA data of ILD samples compared to controls (GSE47460). Samples used in this study from the LTRC n = 254 ILD patients and n = 108 controls.
-
GThe protein features in BALF were used to train a random forest algorithm to predict lung function. The model was tested on transcriptional signatures from single‐cell RNA‐seq data to correctly predict reduced lung function in end‐stage lung fibrosis when compared to controls.
-
H, IBox plots show predicted lung function changes (DLCO%) in the three single‐cell RNA‐seq cohorts (Chicago cohort: ILD n = 9, controls n = 8; Nashville cohort: ILD n = 20, controls n = 10; Munich cohort: ILD n = 3, controls n = 11) in (H) and published bulk RNA‐seq of IPF samples from different histopathological stages (GEO GSE124685) (control n = 35, IPF1 n = 19, IPF2 n = 16, IPF3 n = 14) in (I). The boxes represent the interquartile range, the horizontal line in the box is the median, and the whiskers represent 1.5 times the interquartile range.
