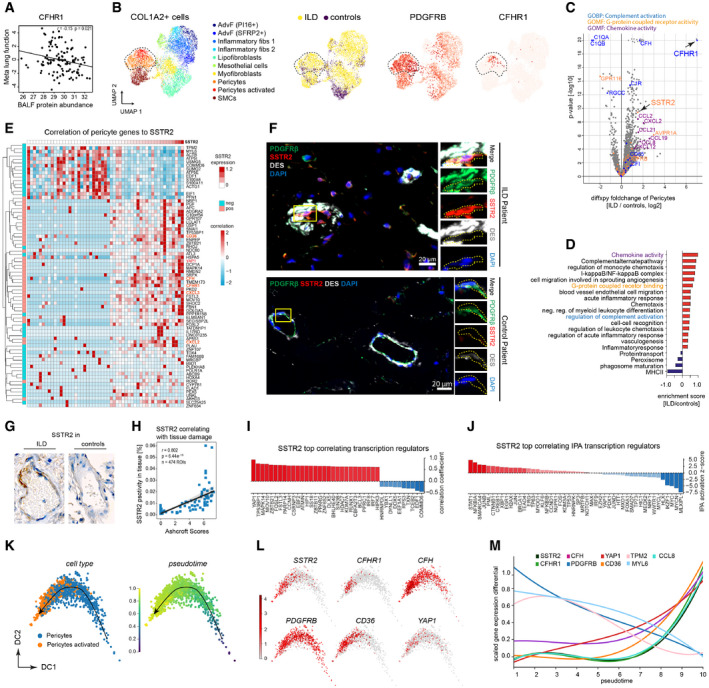
The scatter plots show the positive correlation of CFHR1 in BALF (MS‐intensity, x‐axis) with meta lung function (y‐axis).
The UMAPs show the subset of COL1A2+ mesenchymal cells in the integrated scRNA‐seq dataset, with the pericytes highlighted by the dotted line. From left to right, the colors represent the cell type identities, disease status, expression of the pericyte markers PDGFRB and CFHR1, respectively.
The volcano plot depicts the fold changes (x‐axis) and the −log10
P‐values (y‐axis) derived from the differential gene expression analysis using diffxpy between ILD and controls within the subset of PDGFRB+ pericytes (outlier values truncated).
The bar graphs show the top regulated gene categories after enrichment analysis using GO terms and UniProt keywords.
The heatmap shows the expression of genes most strongly associated with SSTR2 expression within the pericytes (left color bar indicates significant correlation or anti‐correlation).
Immunofluorescence analysis of SSTR2, the pericyte cell type marker PDGFRB and a marker for smooth muscle cells DESMIN in IPF (n = 3) and control samples (n = 3).
Representative images of immunohistochemistry analysis of SSTR2 protein expression in tissue regions (n = 474) from ILD patients (n = 53) and control patients (n = 26).
Correlation of immunohistochemistry signal of SSTR2 with Ashcroft scores.
The bar graph shows the genes most strongly correlated with SSTR2 belonging to the GO category “transcription regulators”. The dotted line marks a correlation coefficient of zero.
The bar graph shows the top correlated transcriptional regulators, predicted by ingenuity pathway analysis (IPA) for the SSTR2 gene‐gene correlations. The dotted line marks a correlation coefficient of zero.
Diffusion map of pericytes colored by cell type and inferred pseudotime represents pericyte differentiation.
Diffusion map of pericytes colored by the gene expression of indicated genes.
The line plot illustrates smoothed expression levels of the indicated genes across the pericyte pseudotime differentiation trajectory.

