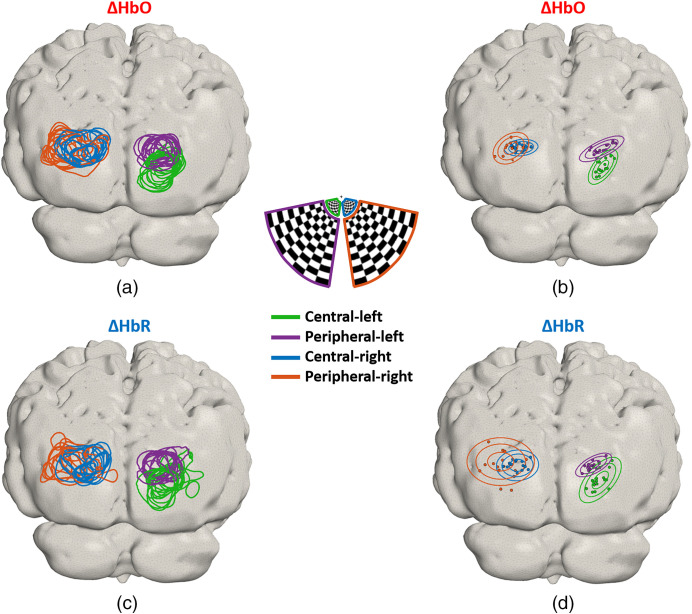
Fig. 11.
(a) Contours at 75% of maximum for each session and (b) the location of maximum increase per session is indicated with the filled circles. Color denotes condition. The elliptical curves are the contours of the 3D Gaussian probability density functions at one, two, and three standard deviations. Similarly, (c) each line is the contour at 75% of minimum for each session. (d) The location of the minimum per session is indicated with filled circles. Each condition is color coded as indicated in the legend.

