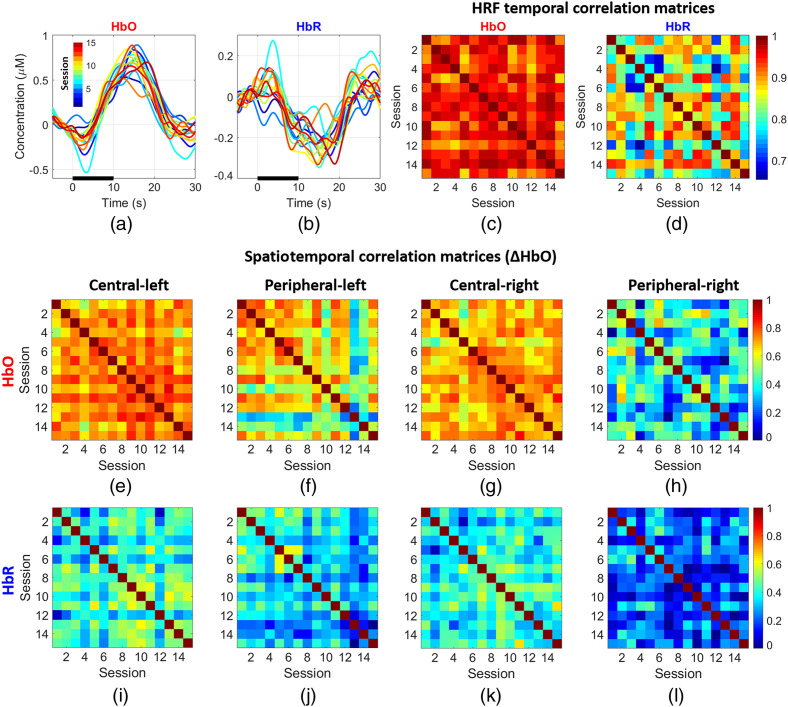
Fig. 12.
(a), (b) Temporal changes of maximum oxy- and deoxy-hemoglobin for the central-left stimulus. Each curve represents a session. (c), (d) The temporal correlation matrix of the HRF at the peak node for each session for and , respectively. Note that the responses across all sessions are very similar; the average Pearson correlation coefficient is 0.95. (e)–(h) Spatiotemporal correlations for all sessions for : each element in the correlation matrix was calculated by correlating the HRFs for all node locations across all 15 sessions. Similarly, panels (i)–(l) are the spatiotemporal correlations at group level for .

