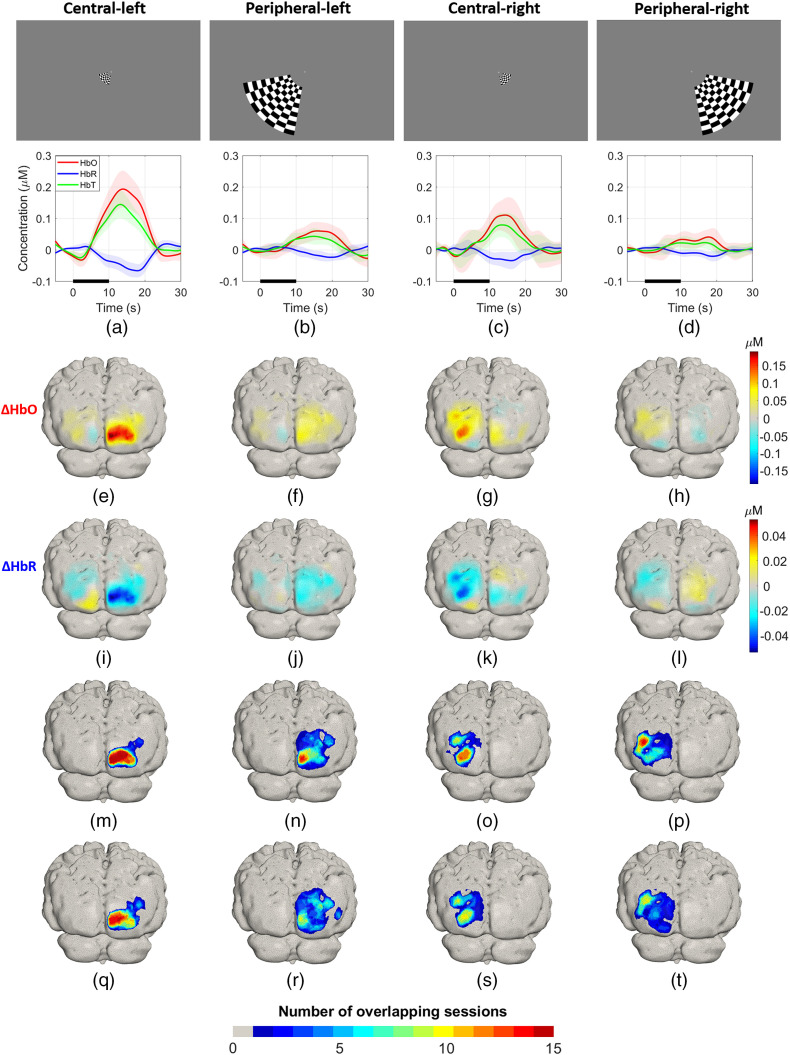
Fig. 13.
(a)–(d) Upper panels: stimuli used for eccentricity experiment. Lower panels: group average HRF obtained with the sparse array indicated in Fig. 1(e). The thick lines indicate the mean , , and across all repetitions, and the shaded bands indicate the standard deviation. (e)–(h) and (i)–(l) Group average and across all sessions for each condition, respectively. (m)–(p) and (q)–(t) Overlap of activations and for each condition.

