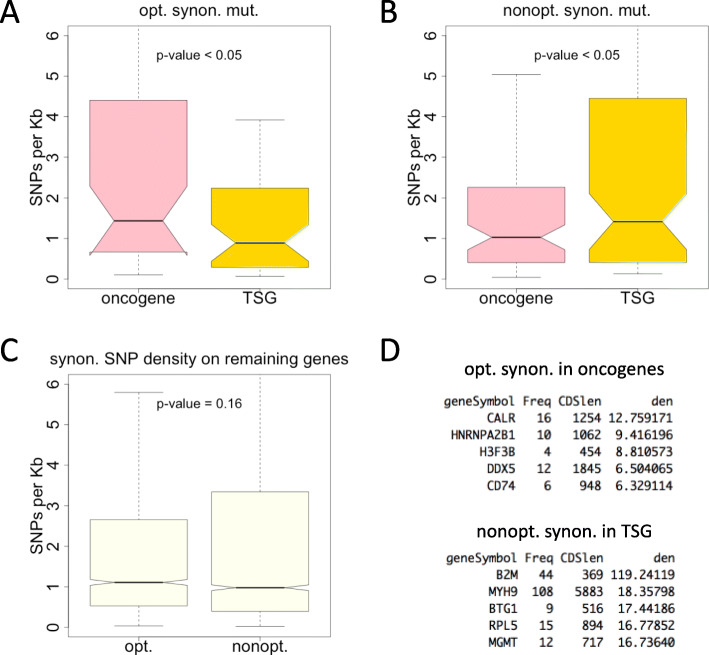
Fig. 5.
SNP density (number of SNPs per Kb CDS) in different genes. a Optimal synonymous SNP density in oncogenes and TSG. KS test was used to calculate p-value. b Non-optimal synonymous SNP density in oncogenes and TSG. KS test was used to calculate p-value. c Synonymous SNP density in the remaining genes. KS test was used to calculate p-value. d Examples of genes with high synonymous SNP density. Oncogenes with the highest optimal synonymous SNP density were shown. TSG with the highest non-optimal synonymous SNP density were shown. “Freq” means number of SNPs

