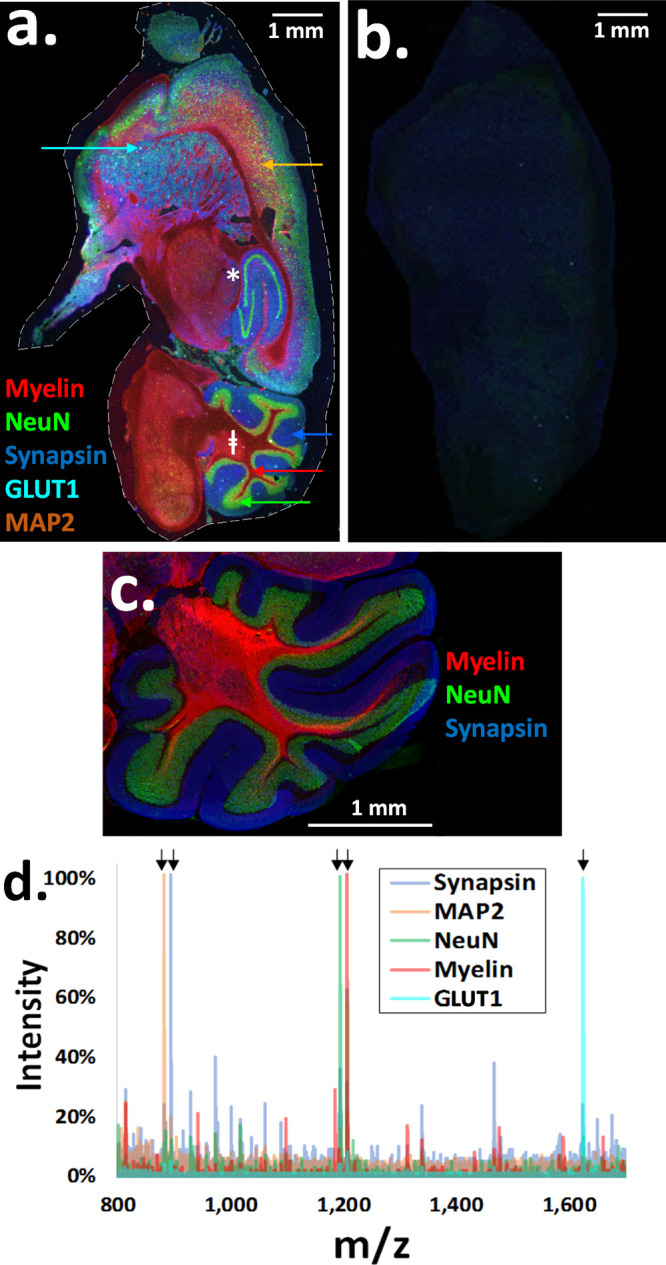
Figure 2.

Multiplex MALDI mass spectrometry-based immunohistochemistry (MALDI-IHC) on five biomarkers in mouse-brain FFPE sagittal tissue sections. FFPE tissue sections were stained simultaneously with PC-MT-antibodies against five different biomarkers, then subjected to MALDI-MSI (in the positive ion reflector mode). Standard immunofluorescence staining was also performed on adjacent tissue sections. (a) Colorized five-plex MALDI-MS image corresponding to the monoisotopic mass reporter m/z values for the following PC-MT-antibodies (color coding is also noted on the image): myelin (red), NeuN (green), synapsin (blue), GLUT1 (cyan), and MAP2 (orange). The display scale (arbitrary peak intensity units), is as follows (minimum intensity/full intensity threshold): 0/27 (myelin), 0/12 (NeuN), 0/7 (synapsin), 0/8 (GLUT1), and 0/21 (MAP2). The hippocampus (∗) and cerebellum (⧧) were observed among other brain structures (all MALDI-MS images have a 20 μm spatial resolution). (b) MALDI-MS image from an adjacent tissue section stained with a rabbit IgG isotype control. The rabbit IgG was labeled with the same PC-MT as the rabbit polyclonal GLUT1 antibody (a mouse IgG isotype control labeled with the same PC-MT as the mouse monoclonal anti-MAP2 antibody was also tested with the same results, not shown). (c) Colorized immunofluorescence overlay of the cerebellum for synapsin (blue), NeuN (green), and myelin basic protein (red). Immunofluorescence was performed in the “single-plex” mode on adjacent tissue sections, and images were colorized and overlaid. (d) Color-coded overlaid MALDI-MS spectra are shown for selected pixels from the five-plex MALDI-MS image (the pixels are denoted with color-coded arrows in panel a). Black arrows in the spectra denote the mass reporter peaks as follows: myelin, 1206.72 m/z (red); NeuN, 1194.67 m/z (green); synapsin, 894.52 m/z (blue); GLUT1, 1624.80 m/z (cyan); and MAP2, 882.46 m/z (orange). Note that while natural isotopes of the mass reporters separated by 1 Da are easily resolved by the MALDI-MS, they are not discernible in the spectra provided due to the compact x-axis scaling.
