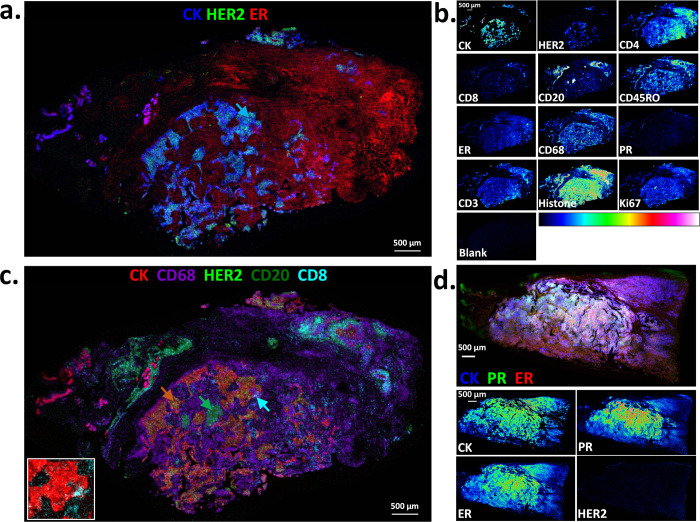
Figure 4.
Multiplex MALDI mass spectrometry-based immunohistochemistry (MALDI-IHC) on 12 biomarkers in human breast cancer FFPE tissue sections. 12-Plex MALDI-IHC was performed as in Figure 3. The color coding of the multicolor images is indicated in the key for each, and the display scales listed below are in arbitrary peak intensity units (as the minimum intensity/full intensity threshold). (a) Multicolor MALDI-MS image overlay of a breast cancer tissue section showing an intensity map of the monoisotopic m/z values for the PC-MTs from CK, HER2, and ER (all MALDI-MS images have a 10 μm spatial resolution). The display scale is as follows: 1/35 (CK), 2/20 (HER2), and 2/8 (ER). According to traditional IHC, this tissue is PR–/ER–/HER2+ (see the main text for more detail). The blue arrow indicates an example tumor region. (b) Individual MALDI-MS images of all 12 biomarkers shown as a color gradient for the entire tissue section. The “blank” is also shown, which is an adjacent tissue section stained with an isotype-control IgG bearing a PC-MT (same PC-MT as CD3). The gradient color scale is also shown. For comparison, the display scale of all biomarkers is 2/20 except for CK, CD3, CD4, CD68, and Ki67, which produced exceptionally strong signals and are therefore set to 5/50. (c.) Multicolor MALDI-MS image overlay of the same breast cancer tissue section showing the selected biomarkers, which highlight tumor-infiltrating immune cells. The display scale is as follows: 1/30 (CK), 3/20 (CD68), 1/10 (HER2), 2/12 (CD20), and 2/7 (CD8). The orange, green, and cyan arrows indicate the tumor (colocalized CK and HER2), CD20+ B-cells, and CD8+ cytotoxic T-cells, respectively. The inset image on the lower left is a magnification of the region indicated by the cyan arrow, showing only CK and CD8. (d.) Multicolor MALDI-MS image overlay (top panel) and individual gradient-scale MALDI-MS images (bottom panels) of selected biomarkers on a different breast cancer tissue section. In this case, this tissue is PR+/ER+/HER2– according to traditional IHC (see the main text for more detail). The display scale for the multicolor image is as follows: 6/55 (CK), 2/20 (PR), and 2/15 (ER). For comparison, the display scale of the gradient color images is 2/20 except for CK, which produced an exceptionally strong signal and is therefore set to 10/100.

