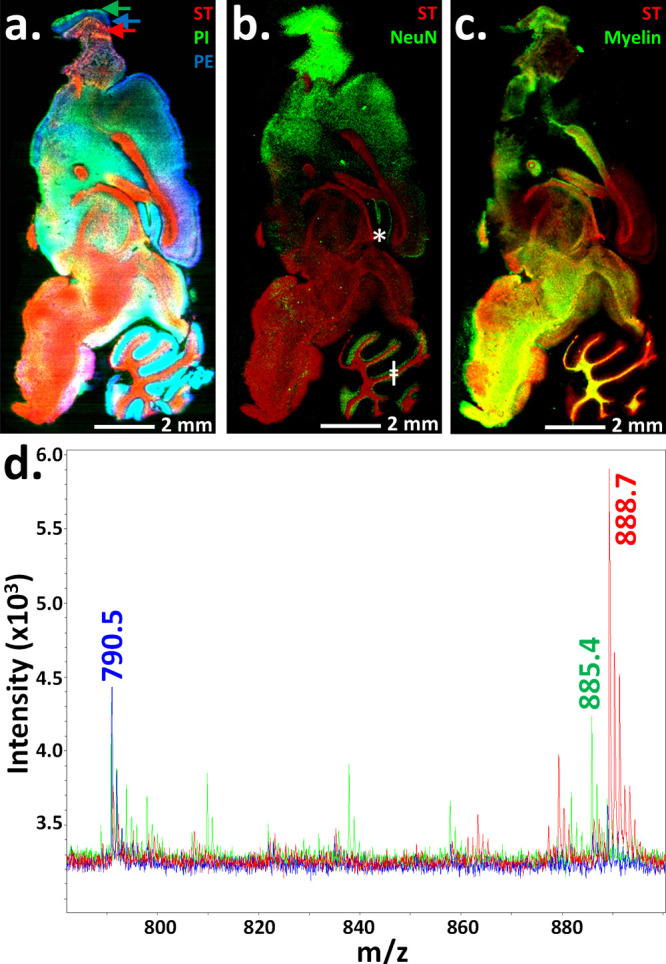
Figure 5.

Untargeted small-molecule MALDI-MSI and targeted MALDI-IHC on the same tissue section. (a) Direct untargeted MALDI-MSI was first performed on an unfixed fresh-frozen mouse brain sagittal tissue section (all MALDI-MS images have a 20 μm spatial resolution). Three well-known lipid species (sulfatide (ST), m/z 888.7; phosphatidylinositol (PI), m/z 885.4; and phosphatidylethanolamine (PE), m/z 790.5) are shown in the colorized MALDI-MS image (red, green, and blue, respectively). The display scale (arbitrary peak intensity units) is as follows (minimum intensity/full intensity threshold): 5/14 (ST), 6/8 (PI), and 7/10 (PE). (b and c) The same tissue section was then processed for a second round of MALDI-MSI. To do so, the matrix was washed away, the tissue was fixed, and MALDI-IHC was performed to detect macromolecular antigens using PC-MT-antibodies. For demonstration purposes, images of selected biomolecules from the first and second rounds of MALDI-MSI were overlaid. (b) Sulfatide (red) from the first round of MALDI-MSI (direct small-molecule detection) is overlaid with the image of NeuN (green) from the second round of MALDI-MSI (MALDI-IHC). The display scale (arbitrary peak intensity units) is as follows (minimum intensity/full intensity threshold): 8/20 (ST) and 1/5 (NeuN). (c) Sulfatide (red) from the first round of MALDI-MSI (direct small-molecule detection) is overlaid with the image of myelin basic protein (green) from the second round of MALDI-MSI (MALDI-IHC). The display scale (arbitrary peak intensity units) is as follows (minimum intensity/full intensity threshold): 8/20 (ST) and 2/20 (myelin). (d) Example overlaid spectra from the first round of MALDI-MSI (direct small-molecule detection) are shown, which were color-coded to match the image in panel a. (the three lipid masses are indicated). The color-coded arrows in panel a indicate the regions from which the MALDI-MS spectra were derived.
