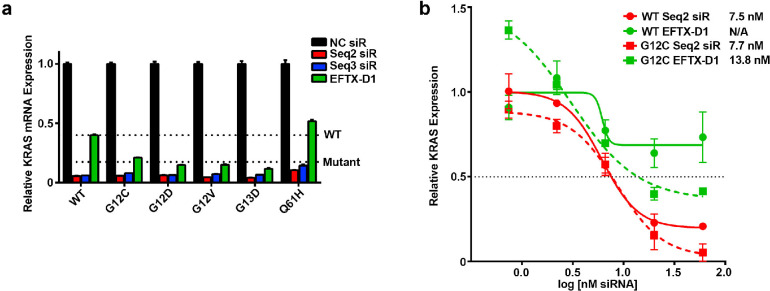
Figure 3.
KRAS mutant-specific knockdown by EFTX-D1. (a) qPCR at 24 h post transfection of NIH/3T3 cells stably expressing KRAS WT, G12C, G12D, G12V, G13D, or Q61H and transiently transfected with 40 nM NC, Seq2, Seq3, or EFTX-D1 siRNA (siR). The “WT” line indicates average expression level of KRAS mRNA with WT codon 12 and codon 13 sequences, in response to EFTX-D1 transfection. The “Mutant” line indicates average expression level of the KRAS mutants carrying codon 12 or codon 13 mutations, in response to EFTX-D1 transfection. qPCR was run in duplicate. (b) qPCR dose response curves of NIH/3T3 cells stably expressing KRAS WT or G12C and transiently transfected with Seq2 or EFTX-D1 siR. Results are shown 24 h post transfection and are normalized to NC siR transfection. qPCR was run in duplicate. IC50 values for siR treatment of each cell line are shown. Error bars represent standard error of the mean.

