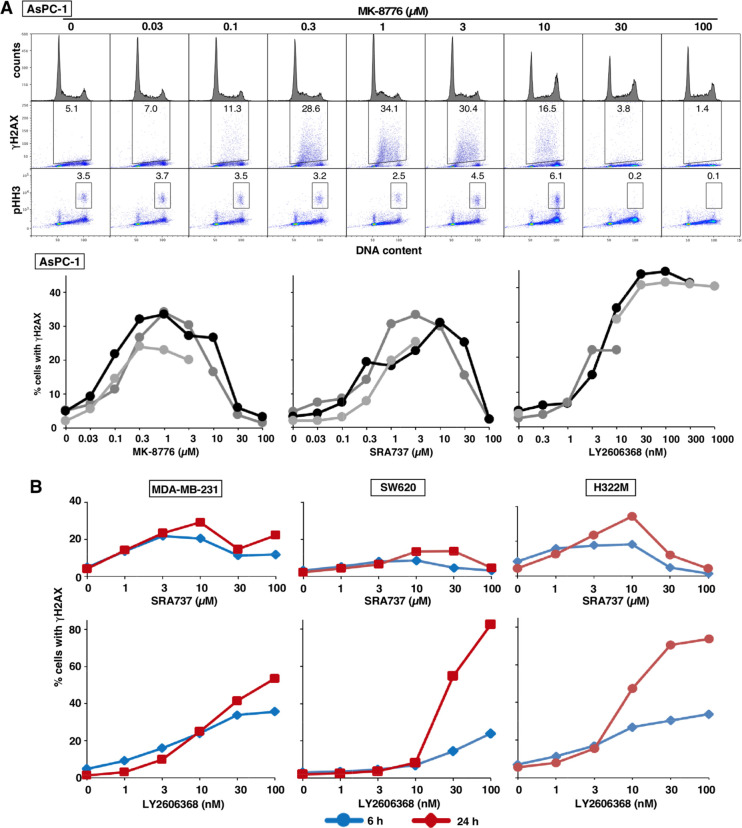
Figure 4.
Induction of γH2AX by CHK1i. (A) ASPC-1 cells were incubated with the indicated concentrations of MK-8776 for 6 h and then analyzed by flow cytometry for DNA content, γH2AX, and pHH3. The percentage of cells positive for γH2AX or pHH3 is indicated. The percentage of γH2AX-positive cells from replicate experiments is presented. (B) MDA-MB-231, SW620, and H322M cells were incubated with the indicated concentrations of each CHK1i for 6 or 24 h and analyzed as in panel A. The flow cytometry data for these analyses are presented in Figure S1.

