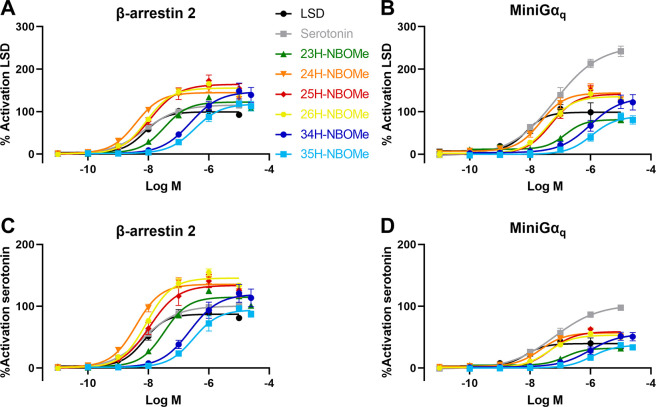
Figure 2.
Concentration–response curves obtained by stimulation of the 5-HT2AR followed by recruitment of (A and C) βarr2 or (B and D) miniGαq constructs in the NanoBiT system. Data points are given as the mean of three independent experiments (each performed in duplicate) ± SEM (standard error of the mean). The AUC is normalized in each independent experiment for the maximum response (100%) of the reference agonist LSD (A and B) or serotonin (C and D).

