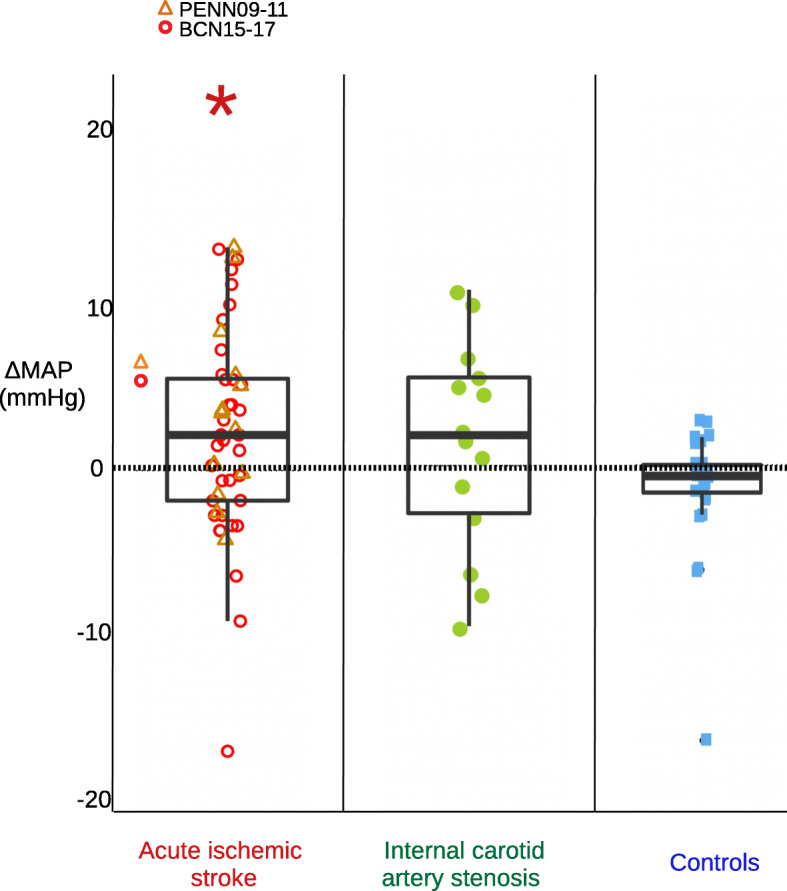
Fig. 4.

Mean arterial pressure response to the transition from the first to second supine position for all cohorts. Mean arterial pressure response (ΔMAP) to the transition from the first to second supine position for all cohorts of patients and for controls is shown. 26 (52) -number of patients (total number of measurements performed)- were included for the acute ischemic stroke group, 14 (14) for the internal carotid artery stenosis group, and 15 (15) healthy controls. Classic boxplots and the mean ΔrCBF data point color-coded for each cohort group are shown. (*) indicates that the mean response differed from zero
