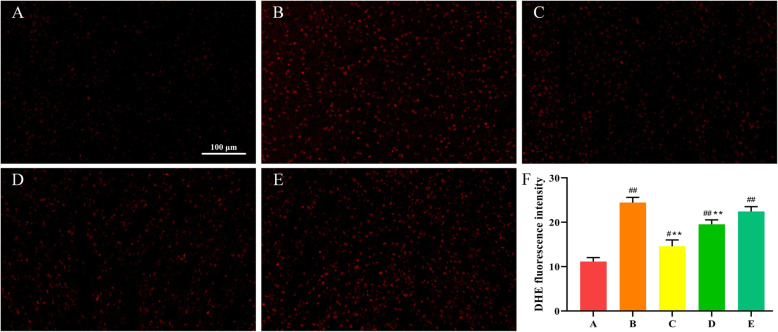
Fig. 4.
ROS expression in liver. The intensity of the red fluorescence reflects the level of ROS. Compared with the control group, the red fluorescence intensity of the T-2 toxin group was significantly enhanced, indicating that the ROS level was significantly increased. After low-dose SeMet pretreatment, ROS levels decreased significantly. However, as the SeMet dose increased, ROS levels in the middle and high-dose groups gradually increased. a: control group, b T-2 toxin group c: low-dose SeMet+T-2 toxin group, d: medium-dose SeMet+T-2 toxin group, e: high-dose SeMet+T-2 toxin group. f: Quantitative analysis of fluorescence intensity of DHE staining using imagej software. Each value is the mean ± SE of five independent determinations. Significant differences were #P < 0.05 or ##P < 0.01 compared to control group; *P < 0.05 or **P < 0.01 compared to T-2 toxin group. Magnification is 200× and scale is 100 μm

