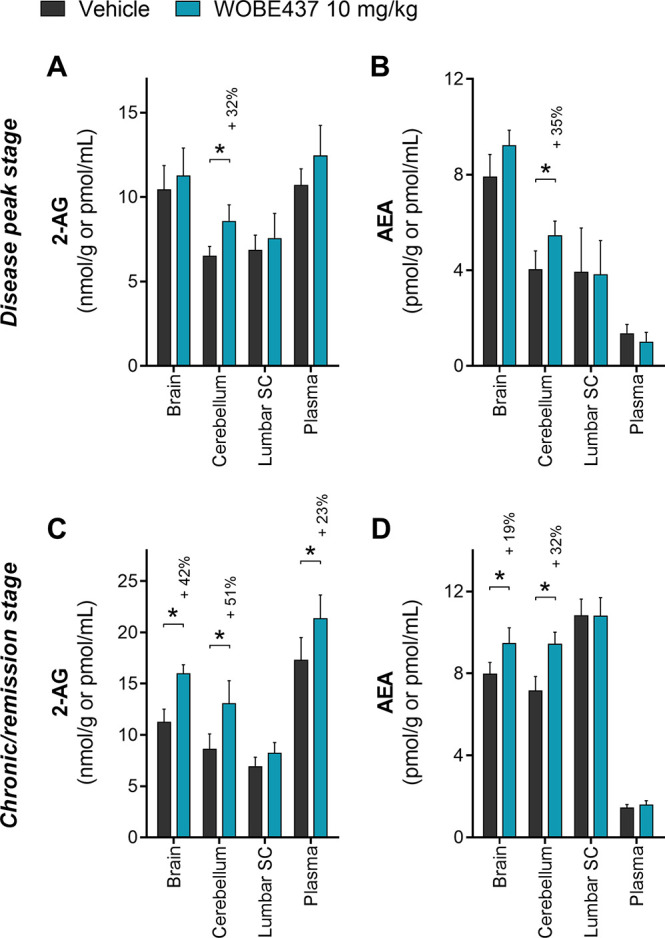
Figure 3.

Quantification of endocannabinoid levels in EAE female C57BL/6 mice treated either with vehicle or WOBE437. (A) 2-AG and (B) AEA were quantified in brain, cerebellum, lumbar SC, and plasma at the peak of the disease (4–6 days after onset; average harvest day was 5 for both groups). (C) 2-AG and (D) AEA were quantified in brain, cerebellum, lumbar SC, and plasma at the chronic/remission stage (20 days after onset). 2-AG and AEA were quantified using LC-MS/MS, and values were normalized to the tissue amount (g) or volume (mL). Vehicle (DMSO) and WOBE437 were given i.p. (20 μL) starting at the disease onset (day 1). Sample size numbers (indicated as vehicle/WOBE437) were the following: (A, B) brain n = 8/9, cerebellum n = 8/9, lumbar SC n = 5/6, and plasma n = 8/9; (C) brain n = 21/17, cerebellum n = 20/15, lumbar SC n = 13/7, and plasma n = 21/17; (D) brain n = 21/17, cerebellum n = 20/15, lumbar SC n = 13/7, plasma n = 22/22. Data show mean ± SD. Statistical differences were determined using the Mann–Whitney test. *, p < 0.05 compare to vehicle group; if significant, then a percentage of increase is reported above.
