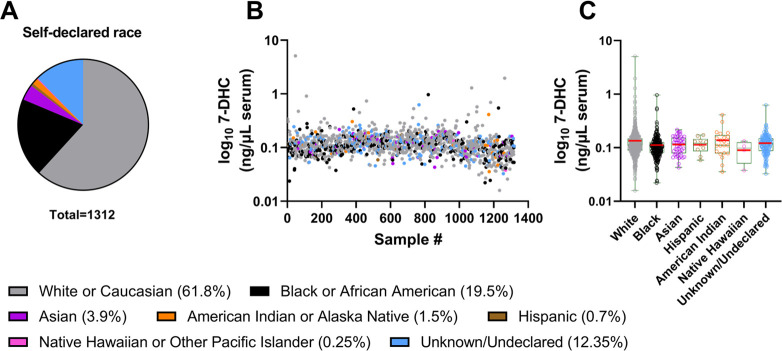
Figure 1.
7-DHC level distribution by self-declared race. (A) Samples were grouped into seven categories based on self-declared race depicted in the figure legend. The group labeled “unknown/undeclared” contained samples from individuals who provided no answer or identified themselves outside the main categories. The proportion of each group is depicted in parentheses. (B) Free 7-DHC levels of all studied samples. X-axis denotes the unique identifier of each sample, and free 7-DHC (ng/μL of serum) is presented using a log10 representation on the Y-axis. Each marker represents a single 7-DHC measurement in a single sample, color-coded for self-declared race. (C) Free 7-DHC (ng/μL of serum) averaged across the samples according to self-declared race. Samples were graphed using a box plot. The red bars correspond to the mean values, and each symbol corresponds to an individual sample. We found that although free 7-DHC levels showed almost a 100-fold variability, mean levels of 7-DHC were comparable across the race categories.

