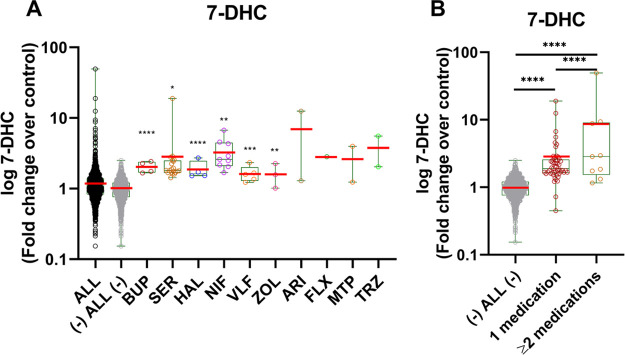
Figure 4.
7-DHC levels in the serum of pregnant women taking medications with the side effects of DHCR7 enzyme inhibition. 7-DHC levels are presented on Y-axis as a log10-fold change over control using “(−) ALL (−)” group as the baseline. The “(−) ALL (−)” group includes all samples without detectable levels of the selected medications. The red bars correspond to the mean values; each symbol corresponds to an individual sample. (A) Comparison of free 7-DHC levels in samples with one detectable DHCR7-inhibiting medication. Groups and medications are denoted on the X-axis (BUP: bupropion; SER: sertraline, HAL: haloperidol; ARI: aripiprazole; FLX: fluoxetine; MTP: metoprolol; and TRZ: trazodone). The 14 medications tested are denoted in Table 1. Samples were graphed using a box plot. Significance was established utilizing an unpaired two-tailed t test in comparison to “(−) ALL (−)” group. (B) Free 7-DHC levels in samples with one or multiple detected DHCR7-inhibiting medications. The multiple medications detected in samples are listed in Table 2. One-way ANOVA and Tukey’s multiple comparisons tests were performed to compare the difference between the three groups; statistical significance: ****p < 0.0001.

