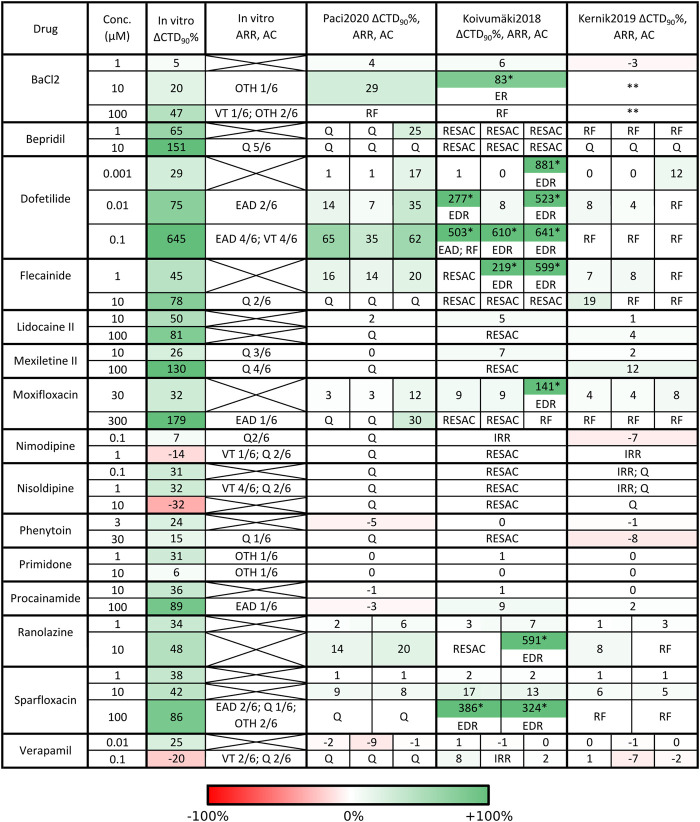
FIGURE 7.
Qualitative and quantitative comparison of in silico drug tests in the three hSC-CM models against our in vitro data, for the 15 reference compounds. For each drug we report i) the tested concentrations, ii) the percent CaT duration variation with respect to baseline (ΔCTD90%), arrhythmic events (ARR) and automaticity cessation (AC) recorded in vitro and in silico. Arrhythmic events: early and delayed after-depolarization (EAD, DAD), repolarization failure (RF), irregular rhythm (IRR), ventricular tachycardia-like rhythm (VT) and other arrhythmic events (OTH). Automaticity cessation (AC): quiescence (Q) and residual activity (RESAC). Q and RESAC are not considered pro-arrhythmic. For Koivumäki2018, the ΔCTD90% marked with a star were computed on EADs and the model showed arrhythmic patterns including the combination of EADs, DADs and RF (shortened as EDR) or EADs and RF (shortened as ER). For Kernik2019, two stars in BaCl2 mean high rate Ca2+ oscillations and depolarized maximum diastolic potential, but no RF. When multiple combinations of IC50 and Hill coefficient were tested in simulation for the same compound, the corresponding in silico results consist of multiple sub-columns. In case of no in vitro arrhythmic events, the corresponding cell contains an X. An expanded version of this table is presented in the Supplementary material as Supplementary Table S2.

