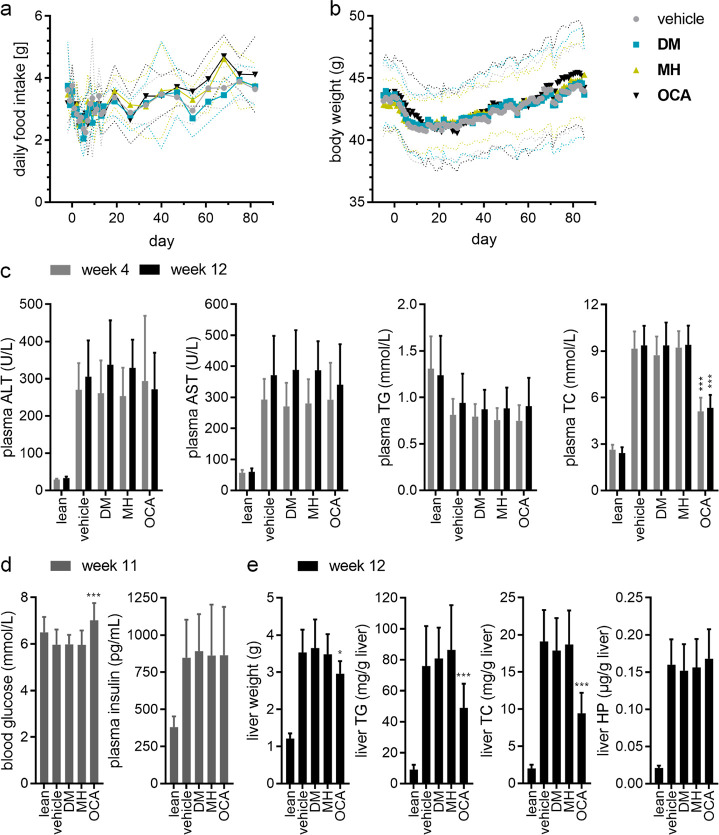
Figure 3.
Food intake and biochemical parameters in the different treatment groups. (a) Daily food intake during the treatment phase. Symbols are the mean; dotted lines are SD (b) Body weight development over the treatment period. Symbols are the mean; dotted lines are SD (c) Plasma biochemical parameters in the treatment groups at week 4 of the treatment period and at termination (week 12). Data are the mean ± SD. ***, p < 0.001 (Dunnett’s test) vs vehicle. (d) Blood glucose and plasma insulin levels in the treatment groups in week 11 of the treatment period. ***, p < 0.001 (Dunnett’s test). (e) Liver biochemical parameters in the treatment groups at termination (week 12). Data are the mean ± SD. *, p < 0.05; ***, p < 0.001 (Dunnett’s test) vs vehicle.

